


| Duration | 0:00 | Takeoff Distance | 0 |
| Height: | metres |
| Climb: | m/sec |
| Speed: | km/h |
| Distance: | km |
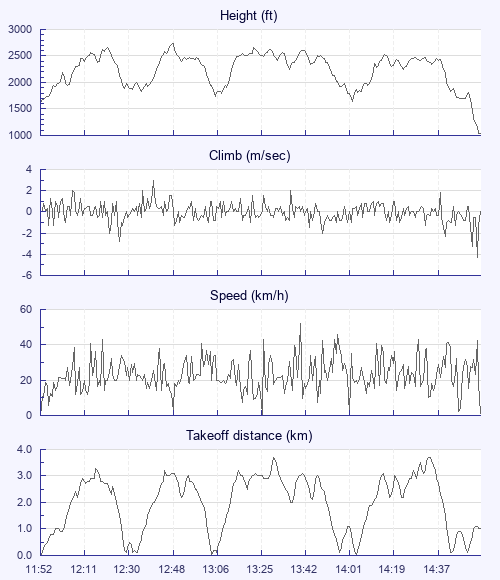
| Height - GPS data | |
| Maximum Height [12:48:21] |
2733 ft |
| Takeoff Height [11:52:31] |
1608 ft |
| Landing Height [14:55:32] |
1030 ft |
| Total Ascent | 11102 ft |
| Height Gain | |
| Above Takeoff | 1125 ft |
| Units | |
| Climb - Pressure data | |
| Maximum Climb [12:40:24] |
3.0 m/s |
| Minimum Climb [14:54:33] |
-4.3 m/s |
| Units | |
| Speed | |
| Maximum Speed [13:42:12] |
52.2 km/h |
| Average Speed around course |
8.1 km/h |
| Average Speed over track length |
23.7 km/h |
| Units | |
| Tracklog | |
| Flight Duration | 3hrs 3mins |
| Track Points | 10974 |
| Recording Interval | 1 secs |
| Statistics Interval | 4 secs |
| Track Length | 72.3 km |
| Units | |
| Flight instrument | |
| Type | Xc_tracer_ii |
| Model | Not Set |
| Firmware | Xc_tracer_ii_r06 |
| Height: | |
| Speed: | |
| Climb: | |
| Distance: |
| Main Map: |
| First Tab: |