


| Duration | 0:00 | Takeoff Distance | 0 |
| Height: | metres |
| Climb: | m/sec |
| Speed: | km/h |
| Distance: | km |
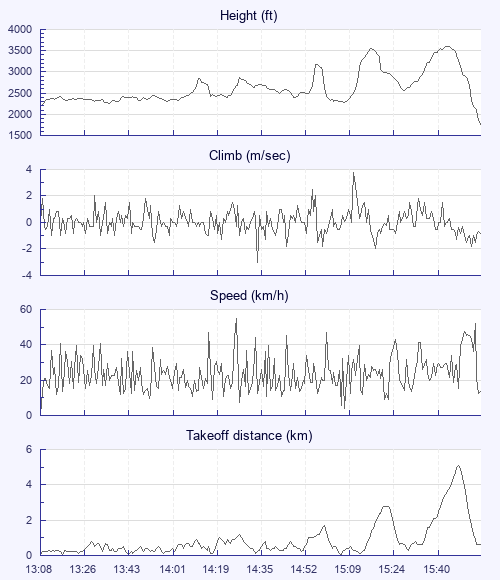
| Height - GPS data | |
| Maximum Height [15:45:59] |
3596 ft |
| Lowest Save [15:09:05] |
2290 ft |
| Takeoff Height [13:08:35] |
2185 ft |
| Landing Height [15:58:09] |
1749 ft |
| Total Ascent | 5860 ft |
| Height Gain | |
| Above Takeoff | 1411 ft |
| Units | |
| Climb - Pressure data | |
| Maximum Climb [15:12:21] |
3.8 m/s |
| Minimum Climb [14:35:37] |
-3.0 m/s |
| Units | |
| Speed | |
| Maximum Speed [14:27:48] |
54.9 km/h |
| Average Speed around course |
17.1 km/h |
| Average Speed over track length |
23.9 km/h |
| Units | |
| Tracklog | |
| Flight Duration | 2hrs 49mins |
| Track Points | 10162 |
| Recording Interval | 1 secs |
| Statistics Interval | 4 secs |
| Track Length | 67.6 km |
| Units | |
| Flight instrument | |
| Type | Flyskyhy |
| Model | 6.14.1 |
| Firmware | 6.14.1 |
| Height: | |
| Speed: | |
| Climb: | |
| Distance: |
| Main Map: |
| First Tab: |