


| Duration | 0:00 | Takeoff Distance | 0 |
| Height: | metres |
| Climb: | m/sec |
| Speed: | km/h |
| Distance: | km |
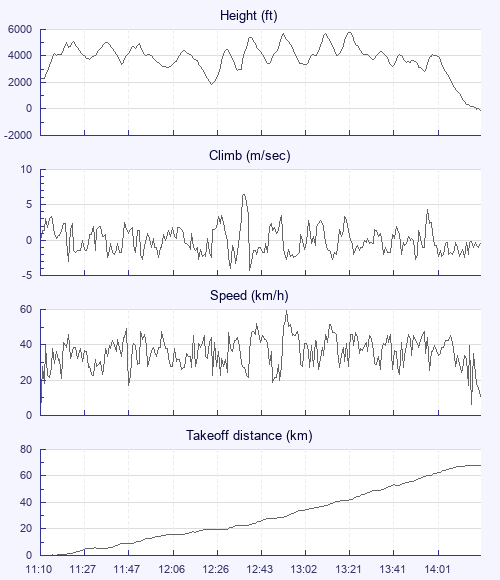
| Height - GPS data | |
| Maximum Height [13:21:50] |
5764 ft |
| Lowest Save [12:24:17] |
1883 ft |
| Takeoff Height [11:10:05] |
2215 ft |
| Landing Height [14:18:41] |
-141 ft |
| Total Ascent | 25751 ft |
| Height Gain | |
| Above Takeoff | 3550 ft |
| Maximum | 3881 ft |
| Low Point as Lowest Save |
1883 ft |
| High Point as Maximum Height |
5764 ft |
| Units | |
| Climb - Pressure data | |
| Maximum Climb [12:37:45] |
6.5 m/s |
| Minimum Climb [12:39:37] |
-4.3 m/s |
| Units | |
| Speed | |
| Maximum Speed [12:55:05] |
59.4 km/h |
| Average Speed around course |
24.8 km/h |
| Average Speed over track length |
35.9 km/h |
| Units | |
| Tracklog | |
| Flight Duration | 3hrs 8mins |
| Track Points | 11317 |
| Recording Interval | 1 secs |
| Statistics Interval | 4 secs |
| Track Length | 112.9 km |
| Units | |
| Flight instrument | |
| Type | Oudie 4 |
| Model | Not Set |
| Firmware | 9.02.001 |
| Height: | |
| Speed: | |
| Climb: | |
| Distance: |
| Main Map: |
| First Tab: |