


| Duration | 0:00 | Takeoff Distance | 0 |
| Height: | metres |
| Climb: | m/sec |
| Speed: | km/h |
| Distance: | km |
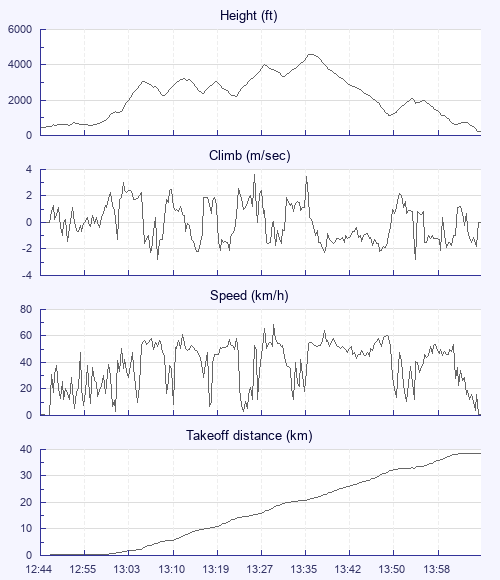
| Height - GPS data | |
| Maximum Height [13:37:19] |
4587 ft |
| Lowest Save [13:51:55] |
1106 ft |
| Takeoff Height [12:44:30] |
469 ft |
| Landing Height [14:08:11] |
243 ft |
| Total Ascent | 9291 ft |
| Height Gain | |
| Above Takeoff | 4117 ft |
| Maximum | 4127 ft |
| Low Point [12:49:01] |
459 ft |
| High Point as Maximum Height |
4587 ft |
| Units | |
| Climb - Pressure data | |
| Maximum Climb [13:26:45] |
3.6 m/s |
| Minimum Climb [13:08:39] |
-2.8 m/s |
| Units | |
| Speed | |
| Maximum Speed [13:30:26] |
68.4 km/h |
| Average Speed around course |
31.0 km/h |
| Average Speed over track length |
37.1 km/h |
| Units | |
| Tracklog | |
| Flight Duration | 1hr 23mins |
| Track Points | 480 |
| Recording Interval | 10 secs |
| Statistics Interval | 10 secs |
| Track Length | 51.7 km |
| Units | |
| Flight instrument | |
| Type | Brauniger |
| Model | Compeo+ |
| Firmware | 3.38m |
| Height: | |
| Speed: | |
| Climb: | |
| Distance: |
| Main Map: |
| First Tab: |