Xc Title
User:Guest
Ozone advert
Frazer Wilson  All flights
National League 2021
Flight type image
Turnpoint Flight on a Paraglider
Club
Sky Surfing
Glider
Date
30th May 2021
Start
14:31
Finish
17:53
Duration
3hrs 22mins
Takeoff
Hambledon Hill
Landing
Otterford
Coords
Takeoff
50.91330, -2.22122
Start
50.91428, -2.21938
TP1
50.83588, -2.36767
TP2
50.83220, -2.50078
TP3
50.80970, -2.47887
Finish
50.93077, -3.10075
Landing
50.93035, -3.09960
Distances and Score
Leg 1
13.60k
Leg 2
9.39k
Leg 3
2.94k
Leg 4
45.80k
Total
71.73k
Score
71.7
Open Distance
Total
62.0k
Filename
Use full pilot name
Download
Validated
Yes
Flight map
Notes

This map gives an overview of the flight, using the turnpoints to plot the track.

Use the for a detailed map and flight track.

Duration 0:00   Takeoff Distance 0
Controls
To animate the flight: click a point on the track, use the slider, or click the Play button.
slider
slider
Speed
Speed
Slower
Faster
Track color
No data
Highlights
Track data
Time: No data
Height:
Climb:
Speed:
Interval:
Units
Height: metres
Climb: m/sec
Speed: km/h
Distance: km
chart
Notes

Climb and Speed averaged over 4 second intervals.

These values may be lower than those shown by a flight instrument, which has access to continuous raw data.

Metric units are used for all chart data, except for Height which is shown in feet.

Height   -   GPS data
Maximum Height
[16:33:00]
5364 ft
Lowest Save
[17:10:03]
1355 ft
Takeoff Height
[14:25:43]
604 ft
Landing Height
[17:53:53]
928 ft
Total Ascent 25650 ft
Height Gain
Above Takeoff 4760 ft
Units
Climb   -   Pressure data
Maximum Climb
[14:42:11]
4.5 m/s
Minimum Climb
[16:06:27]
-6.0 m/s
Units
Speed
Maximum Speed
[17:04:23]
68.4 km/h
Average Speed
around course
21.3 km/h
Average Speed
over track length
39.3 km/h
Units
Tracklog
Flight Duration 3hrs 28mins
Track Points 12491
Recording Interval 1 secs
Statistics Interval 4 secs
Track Length 136.5 km
Units
Flight instrument
Type A-gold Bv9700pro 9
Model Not Set
Firmware 0.9.5.3
Notes

Climb and Speed averaged over 4 second intervals.

These values may be lower than those shown by a flight instrument, which has access to continuous raw data.

Average Speed around course is measured from Start to Finish points.

Track Length is the cumulative distance between track points from Takeoff to Landing.

You can change the default units displayed - see the Options page.

First visit to Hambledon Hill in the great, if slightly bleary company of Dan.

The long wheat out front made inbound thermals pretty easy to spot and we were soon away with a. N. other pilot (name? ) down from London.

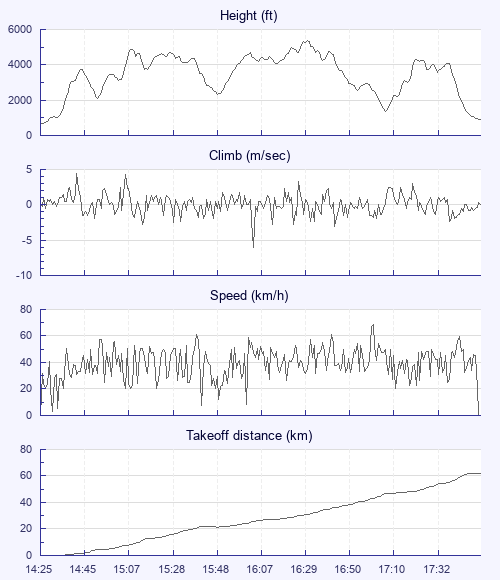
Slightly lumpy inversion early on ≈ 3,500' climbs below were strong, above, more mincing.

We played leapfrog pushing out hunting for climbs on separate tracks then rejoining and were nicely in sync, until I fluffed pushing too far into the blue hole to the North, and had to turn back almost into wind to join Dan who was already speccing out and at Cerne Abbas we were separated by altitude.

I ended up pretty low just downwind of the horny hillside Giant, who clearly had a head of steam on that day, and got a nice steady climb back to ≈ 4,500.

Thereafter we worked the SBF, switching between the lifty but lower Virga at the uphill end of the wedge, to the sporadic and higher clouds triggered further inland by the thin end of the SBF wedge. The front was not a clean, well-defined line, so at one point I fell into the lee side, but with quite a bit of height to spare - I decided to push back through the front to get on the lifty side - wing wobbling around like a jelly, until bashing through the rough and tumble on 3/4 bar, which was much more comfortable.

Past Yeovil, I pushed to a line of clouds to the North of the main line - turns out this was the SBF coming from the Bristol Channel and the wind clearly switch North (instead of due East at launch.

Landed to be met by my mum with a huge G&T and spare ribs for tea: )

Use this page to set various display Options. You can choose which units are used to display flight data, which map to show when the starts and which tab to show each time you view a flight.
Units settings

Metric units are used by default for the Statistics and XC Player pages, except for Height data which is shown in feet. You can choose your own custom settings here.

Height:
Speed:
Climb:
Distance:
  Use default
XC Player settings

When the XC Player starts, the track data is shown on the Hybrid map. You can choose a different map here.

Main Map:
  Use default
Tab settings

The first tab shown when you view a flight is the Flight Map. You can choose a different tab here.

First Tab:
  Use default
Notes

This page uses cookies to save your settings for future visits.

If you have disabled cookies for this site then any changes you make will not be saved.