


| Duration | 0:00 | Takeoff Distance | 0 |
| Height: | metres |
| Climb: | m/sec |
| Speed: | km/h |
| Distance: | km |
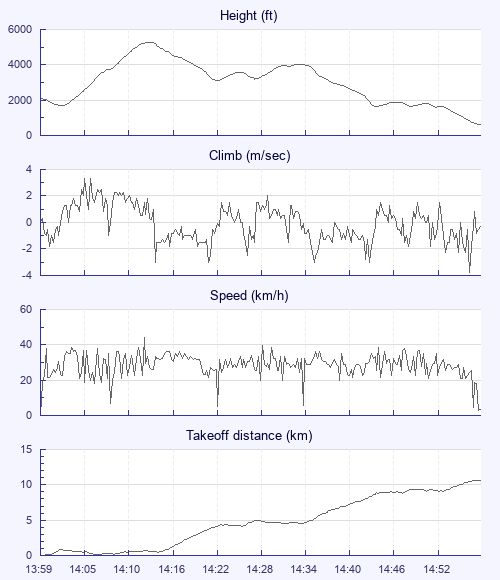
| Height - GPS data | |
| Maximum Height [14:14:10] |
5289 ft |
| Lowest Save [14:23:17] |
3114 ft |
| Takeoff Height [13:59:31] |
2064 ft |
| Landing Height [14:59:57] |
646 ft |
| Total Ascent | 5994 ft |
| Height Gain | |
| Above Takeoff | 3225 ft |
| Maximum | 3599 ft |
| Low Point [14:02:21] |
1690 ft |
| High Point as Maximum Height |
5289 ft |
| Units | |
| Climb - GPS data | |
| Maximum Climb [14:05:31] |
3.3 m/s |
| Minimum Climb [14:58:59] |
-3.8 m/s |
| Units | |
| Speed | |
| Maximum Speed [14:13:35] |
44.1 km/h |
| Average Speed around course |
15.1 km/h |
| Average Speed over track length |
29.2 km/h |
| Units | |
| Tracklog | |
| Flight Duration | 1hr |
| Track Points | 3627 |
| Recording Interval | 1 secs |
| Statistics Interval | 4 secs |
| Track Length | 29.4 km |
| Units | |
| Flight instrument - reported as | |
| Flymaster Live SN00968 SW2.03c |
| Height: | |
| Speed: | |
| Climb: | |
| Distance: |
| Main Map: |
| First Tab: |