


| Duration | 0:00 | Takeoff Distance | 0 |
| Height: | metres |
| Climb: | m/sec |
| Speed: | km/h |
| Distance: | km |
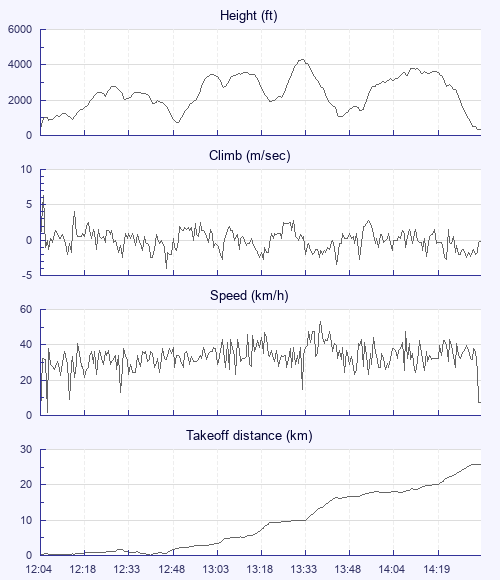
| Height - GPS data | |
| Maximum Height [13:32:40] |
4318 ft |
| Lowest Save [12:49:21] |
732 ft |
| Takeoff Height [12:04:49] |
351 ft |
| Landing Height [14:32:38] |
338 ft |
| Total Ascent | 19416 ft |
| Height Gain | |
| Above Takeoff | 3967 ft |
| Units | |
| Climb - Pressure data | |
| Maximum Climb [12:05:33] |
6.3 m/s |
| Minimum Climb [12:45:53] |
-4.0 m/s |
| Units | |
| Speed | |
| Maximum Speed [13:38:45] |
53.1 km/h |
| Average Speed around course |
12.7 km/h |
| Average Speed over track length |
34.0 km/h |
| Units | |
| Tracklog | |
| Flight Duration | 2hrs 27mins |
| Track Points | 8870 |
| Recording Interval | 1 secs |
| Statistics Interval | 4 secs |
| Track Length | 83.7 km |
| Units | |
| Flight instrument | |
| Type | Xc_tracer_maxx |
| Model | Not Set |
| Firmware | Xc_tracer_maxx_r07_rc02 |
| Height: | |
| Speed: | |
| Climb: | |
| Distance: |
| Main Map: |
| First Tab: |