


| Duration | 0:00 | Takeoff Distance | 0 |
| Height: | metres |
| Climb: | m/sec |
| Speed: | km/h |
| Distance: | km |
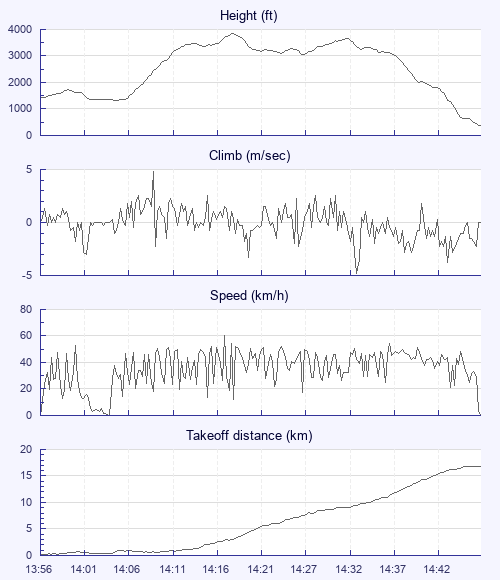
| Height - GPS data | |
| Maximum Height [14:18:52] |
3842 ft |
| Lowest Save [14:27:10] |
3064 ft |
| Takeoff Height [13:56:25] |
1388 ft |
| Landing Height [14:47:49] |
384 ft |
| Total Ascent | 5144 ft |
| Height Gain | |
| Above Takeoff | 2454 ft |
| Maximum | 2543 ft |
| Low Point [14:05:06] |
1299 ft |
| High Point as Maximum Height |
3842 ft |
| Units | |
| Climb - Pressure data | |
| Maximum Climb [14:09:13] |
4.8 m/s |
| Minimum Climb [14:33:37] |
-4.8 m/s |
| Units | |
| Speed | |
| Maximum Speed [14:18:01] |
60.3 km/h |
| Average Speed around course |
22.7 km/h |
| Average Speed over track length |
36.3 km/h |
| Units | |
| Tracklog | |
| Flight Duration | 51mins |
| Track Points | 3085 |
| Recording Interval | 1 secs |
| Statistics Interval | 4 secs |
| Track Length | 31.1 km |
| Units | |
| Flight instrument | |
| Type | Samsung Sm-g991b 11 |
| Model | Not Set |
| Firmware | 0.9.5.3 |
| Height: | |
| Speed: | |
| Climb: | |
| Distance: |
| Main Map: |
| First Tab: |