


| Duration | 0:00 | Takeoff Distance | 0 |
| Height: | metres |
| Climb: | m/sec |
| Speed: | km/h |
| Distance: | km |
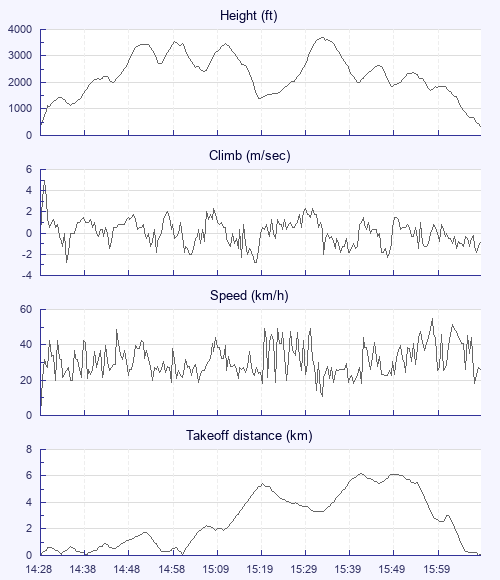
| Height - GPS data | |
| Maximum Height [15:34:58] |
3704 ft |
| Lowest Save [15:20:38] |
1394 ft |
| Takeoff Height [14:28:25] |
328 ft |
| Landing Height [16:12:00] |
341 ft |
| Total Ascent | 11109 ft |
| Height Gain | |
| Above Takeoff | 3376 ft |
| Units | |
| Climb - Pressure data | |
| Maximum Climb [14:29:09] |
5.0 m/s |
| Minimum Climb [14:34:21] |
-2.8 m/s |
| Units | |
| Speed | |
| Maximum Speed [16:00:37] |
54.9 km/h |
| Average Speed around course |
15.0 km/h |
| Average Speed over track length |
31.5 km/h |
| Units | |
| Tracklog | |
| Flight Duration | 1hr 43mins |
| Track Points | 6216 |
| Recording Interval | 1 secs |
| Statistics Interval | 4 secs |
| Track Length | 54.3 km |
| Units | |
| Flight instrument | |
| Type | Oudie 4 Full |
| Model | Y |
| Firmware | 9.31.001 |
| Height: | |
| Speed: | |
| Climb: | |
| Distance: |
| Main Map: |
| First Tab: |