


| Duration | 0:00 | Takeoff Distance | 0 |
| Height: | metres |
| Climb: | m/sec |
| Speed: | km/h |
| Distance: | km |
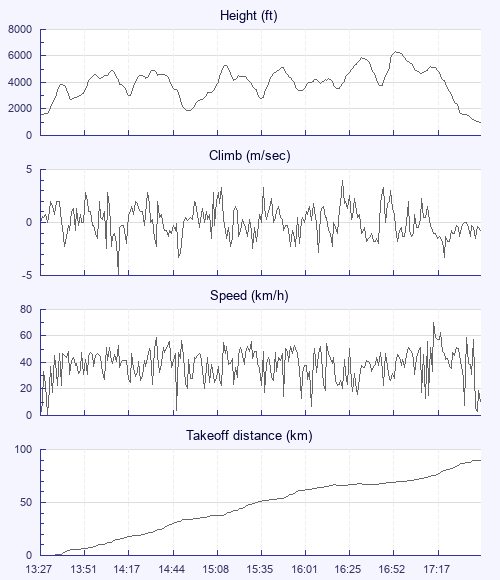
| Height - GPS data | |
| Maximum Height [16:57:50] |
6332 ft |
| Lowest Save [14:53:19] |
1893 ft |
| Takeoff Height [13:27:18] |
1562 ft |
| Landing Height [17:45:23] |
965 ft |
| Total Ascent | 21178 ft |
| Height Gain | |
| Above Takeoff | 4770 ft |
| Maximum | 4780 ft |
| Low Point [13:27:45] |
1552 ft |
| High Point as Maximum Height |
6332 ft |
| Units | |
| Climb - Pressure data | |
| Maximum Climb [16:25:50] |
4.0 m/s |
| Minimum Climb [14:12:22] |
-5.0 m/s |
| Units | |
| Speed | |
| Maximum Speed [17:20:06] |
70.2 km/h |
| Average Speed around course |
26.5 km/h |
| Average Speed over track length |
38.7 km/h |
| Units | |
| Tracklog | |
| Flight Duration | 4hrs 18mins |
| Track Points | 15486 |
| Recording Interval | 1 secs |
| Statistics Interval | 4 secs |
| Track Length | 166.6 km |
| Units | |
| Flight instrument | |
| Type | Samsung Sm-g955f 9 |
| Model | Not Set |
| Firmware | 0.9.4.4 |
| Height: | |
| Speed: | |
| Climb: | |
| Distance: |
| Main Map: |
| First Tab: |