


| Duration | 0:00 | Takeoff Distance | 0 |
| Height: | metres |
| Climb: | m/sec |
| Speed: | km/h |
| Distance: | km |
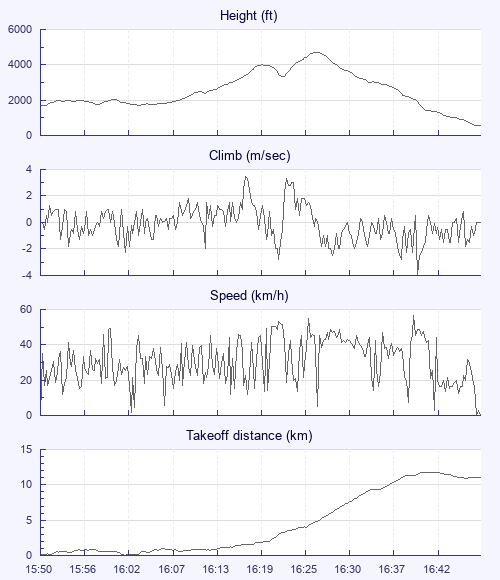
| Height - GPS data | |
| Maximum Height [16:28:03] |
4724 ft |
| Lowest Save [16:23:26] |
3327 ft |
| Takeoff Height [15:50:10] |
1683 ft |
| Landing Height [16:50:22] |
538 ft |
| Total Ascent | 5679 ft |
| Height Gain | |
| Above Takeoff | 3041 ft |
| Maximum | 3045 ft |
| Low Point [15:50:13] |
1680 ft |
| High Point as Maximum Height |
4724 ft |
| Units | |
| Climb - Pressure data | |
| Maximum Climb [16:18:14] |
3.5 m/s |
| Minimum Climb [16:41:54] |
-4.0 m/s |
| Units | |
| Speed | |
| Maximum Speed [16:41:34] |
56.7 km/h |
| Average Speed around course |
20.2 km/h |
| Average Speed over track length |
31.1 km/h |
| Units | |
| Tracklog | |
| Flight Duration | 1hr |
| Track Points | 3608 |
| Recording Interval | 1 secs |
| Statistics Interval | 4 secs |
| Track Length | 31.2 km |
| Units | |
| Flight instrument | |
| Type | Xc_tracer_ii |
| Model | Not Set |
| Firmware | Xc_tracer_ii_r05 |
| Height: | |
| Speed: | |
| Climb: | |
| Distance: |
| Main Map: |
| First Tab: |