


| Duration | 0:00 | Takeoff Distance | 0 |
| Height: | metres |
| Climb: | m/sec |
| Speed: | km/h |
| Distance: | km |
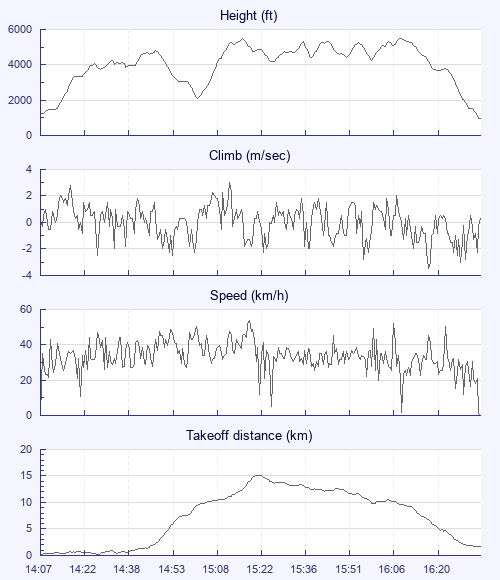
| Height - GPS data | |
| Maximum Height [16:11:02] |
5512 ft |
| Lowest Save [15:02:04] |
2119 ft |
| Takeoff Height [14:07:24] |
1253 ft |
| Landing Height [16:36:52] |
938 ft |
| Total Ascent | 15640 ft |
| Height Gain | |
| Above Takeoff | 4259 ft |
| Maximum | 4288 ft |
| Low Point [14:07:46] |
1224 ft |
| High Point as Maximum Height |
5512 ft |
| Units | |
| Climb - Pressure data | |
| Maximum Climb [15:13:16] |
3.0 m/s |
| Minimum Climb [16:19:40] |
-3.5 m/s |
| Units | |
| Speed | |
| Maximum Speed [15:19:40] |
54.0 km/h |
| Average Speed around course |
17.5 km/h |
| Average Speed over track length |
33.9 km/h |
| Units | |
| Tracklog | |
| Flight Duration | 2hrs 29mins |
| Track Points | 8969 |
| Recording Interval | 1 secs |
| Statistics Interval | 4 secs |
| Track Length | 84.5 km |
| Units | |
| Flight instrument | |
| Type | Samsung Sm-j530f 9 |
| Model | Not Set |
| Firmware | 0.9.6.1-beta |
| Height: | |
| Speed: | |
| Climb: | |
| Distance: |
| Main Map: |
| First Tab: |