


| Duration | 0:00 | Takeoff Distance | 0 |
| Height: | metres |
| Climb: | m/sec |
| Speed: | km/h |
| Distance: | km |
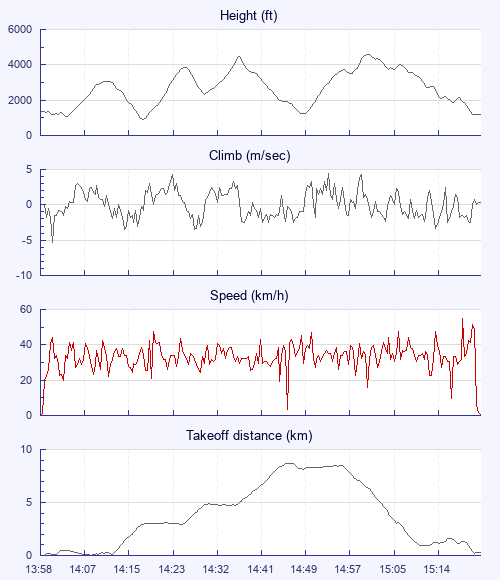
| Height - GPS data | |
| Maximum Height [15:02:45] |
4593 ft |
| Lowest Save [14:18:27] |
928 ft |
| Takeoff Height [13:58:38] |
1358 ft |
| Landing Height [15:24:44] |
1201 ft |
| Total Ascent | 13084 ft |
| Height Gain | |
| Above Takeoff | 3235 ft |
| Maximum | 3665 ft |
| Low Point as Lowest Save |
928 ft |
| High Point as Maximum Height |
4593 ft |
| Units | |
| Climb - GPS data | |
| Maximum Climb [14:55:24] |
4.5 m/s |
| Minimum Climb [14:00:46] |
-5.3 m/s |
| Units | |
| Speed | |
| Maximum Speed [15:21:58] |
54.9 km/h |
| Average Speed around course |
17.7 km/h |
| Average Speed over track length |
33.2 km/h |
| Units | |
| Tracklog | |
| Flight Duration | 1hr 26mins |
| Track Points | 5168 |
| Recording Interval | 1 secs |
| Statistics Interval | 4 secs |
| Track Length | 47.7 km |
| Invalid Positions [< 1%] |
24 |
| Units | |
| Flight instrument | |
| Type | Naviter |
| Model | Apple Iphone |
| Firmware | 1.1.1 |
| Height: | |
| Speed: | |
| Climb: | |
| Distance: |
| Main Map: |
| First Tab: |