Xc Title
User:Guest
Ozone advert
Ed Cleasby  All flights
National League 2021
Flight type image
Turnpoint Flight on a Paraglider
Club
Dales
Glider
Flow Fusion
Date
19th July 2021
Start
12:32
Finish
15:45
Duration
3hrs 12mins
Takeoff
Dodd Fell
Landing
Nr Ellingstring
Coords
Takeoff
54.25277, -2.25612
Start
54.25172, -2.25747
TP1
54.27307, -2.19738
TP2
54.29208, -2.25860
TP3
54.19418, -2.00185
Finish
54.25593, -1.75170
Landing
54.25592, -1.75170
Distances and Score
Leg 1
4.58k
Leg 2
4.51k
Leg 3
19.97k
Leg 4
17.70k
Total
46.76k
Score
46.8
Open Distance
Total
33.3k
Filename
Use full pilot name
Download
Validated
Yes
Flight map
Notes

This map gives an overview of the flight, using the turnpoints to plot the track.

Use the for a detailed map and flight track.

Duration 0:00   Takeoff Distance 0
Controls
To animate the flight: click a point on the track, use the slider, or click the Play button.
slider
slider
Speed
Speed
Slower
Faster
Track color
No data
Highlights
Track data
Time: No data
Height:
Climb:
Speed:
Interval:
Units
Height: metres
Climb: m/sec
Speed: km/h
Distance: km
chart
Notes

Climb and Speed averaged over 4 second intervals.

These values may be lower than those shown by a flight instrument, which has access to continuous raw data.

Metric units are used for all chart data, except for Height which is shown in feet.

Height   -   GPS data
Maximum Height
[15:03:24]
6273 ft
Lowest Save
[12:45:39]
2546 ft
Takeoff Height
[12:15:02]
2037 ft
Landing Height
[15:45:23]
650 ft
Total Ascent 21073 ft
Height Gain
Above Takeoff 4236 ft
Maximum 4245 ft
Low Point
[12:15:05]
2028 ft
High Point
as Maximum Height
6273 ft
Units
Climb   -   Pressure data
Maximum Climb
[15:00:38]
4.3 m/s
Minimum Climb
[15:16:18]
-5.0 m/s
Units
Speed
Maximum Speed
[15:05:06]
62.1 km/h
Average Speed
around course
14.5 km/h
Average Speed
over track length
32.7 km/h
Units
Tracklog
Flight Duration 3hrs 30mins
Track Points 12622
Recording Interval 1 secs
Statistics Interval 4 secs
Track Length 114.7 km
Units
Flight instrument   -   reported as
SKYTRAXX
Notes

Climb and Speed averaged over 4 second intervals.

These values may be lower than those shown by a flight instrument, which has access to continuous raw data.

Average Speed around course is measured from Start to Finish points.

Track Length is the cumulative distance between track points from Takeoff to Landing.

You can change the default units displayed - see the Options page.

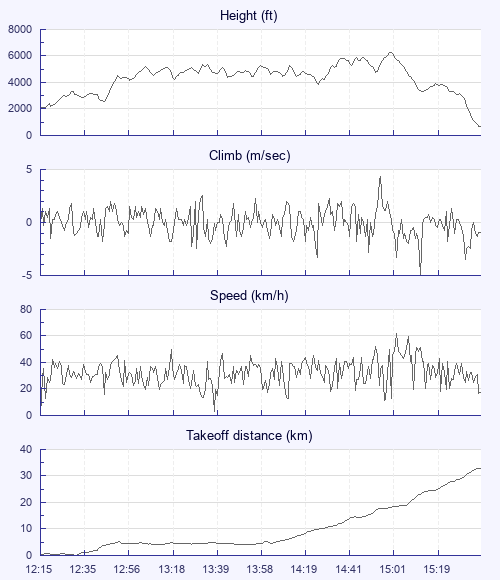
Excellent flying, but limited to the central Dales area - on all sides the cloudbase dropped by a huge 2000' (spectacular if nothing else). It (seemed) like a combination of powerful sea breeze encroachments from E and SW augmented and held by strong convection over the central high moors. So boxed in basically and even the planned triangle couldn't stray far enough from the area that worked. Still… Rare to get 2000' near walls of cloud and pretty awesome to look at.

Use this page to set various display Options. You can choose which units are used to display flight data, which map to show when the starts and which tab to show each time you view a flight.
Units settings

Metric units are used by default for the Statistics and XC Player pages, except for Height data which is shown in feet. You can choose your own custom settings here.

Height:
Speed:
Climb:
Distance:
  Use default
XC Player settings

When the XC Player starts, the track data is shown on the Hybrid map. You can choose a different map here.

Main Map:
  Use default
Tab settings

The first tab shown when you view a flight is the Flight Map. You can choose a different tab here.

First Tab:
  Use default
Notes

This page uses cookies to save your settings for future visits.

If you have disabled cookies for this site then any changes you make will not be saved.