Xc Title
User:Guest
Ozone advert
Paul Collender  All flights
National League 2021
Flight type image
Turnpoint Flight on a Paraglider
Club
Avon
Glider
Triple Seven Q-Light
Date
20th July 2021
Start
15:15
Finish
16:39
Duration
1hr 24mins
Takeoff
Frocester
Landing
Painswick
Coords
Takeoff
51.70915, -2.30008
Start
51.71315, -2.30047
TP1
51.69768, -2.29500
TP2
51.71358, -2.30855
TP3
51.73540, -2.22655
Finish
51.77910, -2.20778
Landing
51.77792, -2.20832
Distances and Score
Leg 1
1.76k
Leg 2
2.00k
Leg 3
6.16k
Leg 4
5.03k
Total
14.95k
Score
15.0
Open Distance
Total
11.0k
Filename
Use full pilot name
Download
Validated
Yes
Flight map
Notes

This map gives an overview of the flight, using the turnpoints to plot the track.

Use the for a detailed map and flight track.

Duration 0:00   Takeoff Distance 0
Controls
To animate the flight: click a point on the track, use the slider, or click the Play button.
slider
slider
Speed
Speed
Slower
Faster
Track color
No data
Highlights
Track data
Time: No data
Height:
Climb:
Speed:
Interval:
Units
Height: metres
Climb: m/sec
Speed: km/h
Distance: km
chart
Notes

Climb and Speed averaged over 4 second intervals.

These values may be lower than those shown by a flight instrument, which has access to continuous raw data.

Metric units are used for all chart data, except for Height which is shown in feet.

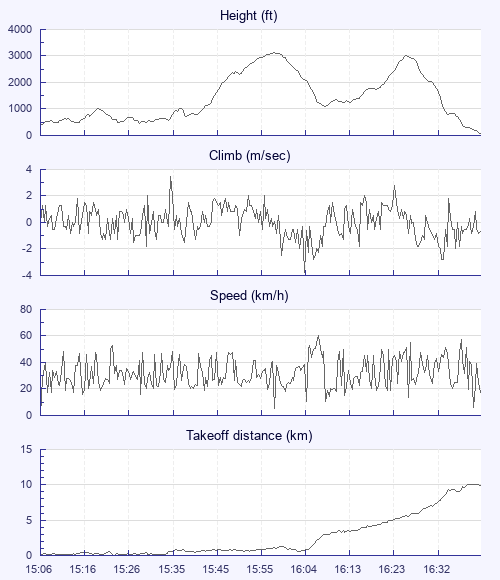
Height   -   Pressure data
Maximum Height
[15:58:32]
3120 ft
Lowest Save
[16:08:10]
1112 ft
Takeoff Height
[15:06:29]
427 ft
Landing Height
[16:41:35]
62 ft
Total Ascent 9675 ft
Height Gain
Above Takeoff 2694 ft
Maximum 2730 ft
Low Point
[15:06:46]
390 ft
High Point
as Maximum Height
3120 ft
Units
Climb   -   Pressure data
Maximum Climb
[15:35:25]
3.5 m/s
Minimum Climb
[16:04:29]
-3.8 m/s
Units
Speed
Maximum Speed
[16:06:57]
60.3 km/h
Average Speed
around course
10.7 km/h
Average Speed
over track length
32.6 km/h
Units
Tracklog
Flight Duration 1hr 35mins
Track Points 5707
Recording Interval 1 secs
Statistics Interval 4 secs
Track Length 51.6 km
Units
Flight instrument
Type Xc_tracer_maxx
Model Not Set
Firmware Xc_tracer_maxx_r07
Notes

Climb and Speed averaged over 4 second intervals.

These values may be lower than those shown by a flight instrument, which has access to continuous raw data.

Average Speed around course is measured from Start to Finish points.

Track Length is the cumulative distance between track points from Takeoff to Landing.

You can change the default units displayed - see the Options page.

Use this page to set various display Options. You can choose which units are used to display flight data, which map to show when the starts and which tab to show each time you view a flight.
Units settings

Metric units are used by default for the Statistics and XC Player pages, except for Height data which is shown in feet. You can choose your own custom settings here.

Height:
Speed:
Climb:
Distance:
  Use default
XC Player settings

When the XC Player starts, the track data is shown on the Hybrid map. You can choose a different map here.

Main Map:
  Use default
Tab settings

The first tab shown when you view a flight is the Flight Map. You can choose a different tab here.

First Tab:
  Use default
Notes

This page uses cookies to save your settings for future visits.

If you have disabled cookies for this site then any changes you make will not be saved.