Xc Title
User:Guest
Cloudbase Paragliding advert
David Smart  All flights
National League 2021
Flight type image
Out and Return on a Paraglider
Club
North Yorks
Glider
Ozone Zeno
Date
20th July 2021
Start
14:19
Finish
18:57
Duration
4hrs 37mins
Takeoff
Dodd
Coords
Takeoff
54.25067, -2.26218
Start
54.23828, -2.23063
TP1
54.06205, -1.63600
TP2
54.23463, -2.23830
Finish
54.23463, -2.23830
Landing
54.23438, -2.23888
Distance and Score
Distance
87.58k
Deductions
0.64k  (circuit gap 644m)
Total
86.94k
Multiplier
x 2.00
Score
173.9
Open Distance
Total
46.1k
Filename
Use full pilot name
Download
Validated
Yes
Flight map
Notes

This map gives an overview of the flight, using the turnpoints to plot the track.

Use the for a detailed map and flight track.

Duration 0:00   Takeoff Distance 0
Controls
To animate the flight: click a point on the track, use the slider, or click the Play button.
slider
slider
Speed
Speed
Slower
Faster
Track color
No data
Highlights
Track data
Time: No data
Height:
Climb:
Speed:
Interval:
Units
Height: metres
Climb: m/sec
Speed: km/h
Distance: km
chart
Notes

Climb and Speed averaged over 4 second intervals.

These values may be lower than those shown by a flight instrument, which has access to continuous raw data.

Metric units are used for all chart data, except for Height which is shown in feet.

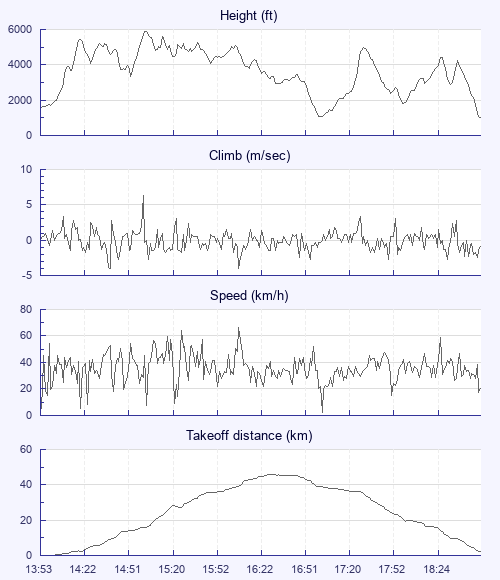
Height   -   Pressure data
Maximum Height
[15:02:57]
5886 ft
Lowest Save
[17:04:27]
1076 ft
Takeoff Height
[13:53:04]
1542 ft
Landing Height
[18:58:07]
1024 ft
Total Ascent 29593 ft
Height Gain
Above Takeoff 4344 ft
Maximum 4347 ft
Low Point
[13:53:10]
1539 ft
High Point
as Maximum Height
5886 ft
Units
Climb   -   Pressure data
Maximum Climb
[15:02:12]
6.3 m/s
Minimum Climb
[14:38:56]
-4.0 m/s
Units
Speed
Maximum Speed
[16:09:08]
66.6 km/h
Average Speed
around course
18.8 km/h
Average Speed
over track length
36.1 km/h
Units
Tracklog
Flight Duration 5hrs 5mins
Track Points 18304
Recording Interval 1 secs
Statistics Interval 4 secs
Track Length 183.5 km
Units
Flight instrument
Type Samsung Sm-g955f 9
Model Not Set
Firmware 0.9.5.3
Notes

Climb and Speed averaged over 4 second intervals.

These values may be lower than those shown by a flight instrument, which has access to continuous raw data.

Average Speed around course is measured from Start to Finish points.

Track Length is the cumulative distance between track points from Takeoff to Landing.

You can change the default units displayed - see the Options page.

Use this page to set various display Options. You can choose which units are used to display flight data, which map to show when the starts and which tab to show each time you view a flight.
Units settings

Metric units are used by default for the Statistics and XC Player pages, except for Height data which is shown in feet. You can choose your own custom settings here.

Height:
Speed:
Climb:
Distance:
  Use default
XC Player settings

When the XC Player starts, the track data is shown on the Hybrid map. You can choose a different map here.

Main Map:
  Use default
Tab settings

The first tab shown when you view a flight is the Flight Map. You can choose a different tab here.

First Tab:
  Use default
Notes

This page uses cookies to save your settings for future visits.

If you have disabled cookies for this site then any changes you make will not be saved.