


| Duration | 0:00 | Takeoff Distance | 0 |
| Height: | metres |
| Climb: | m/sec |
| Speed: | km/h |
| Distance: | km |
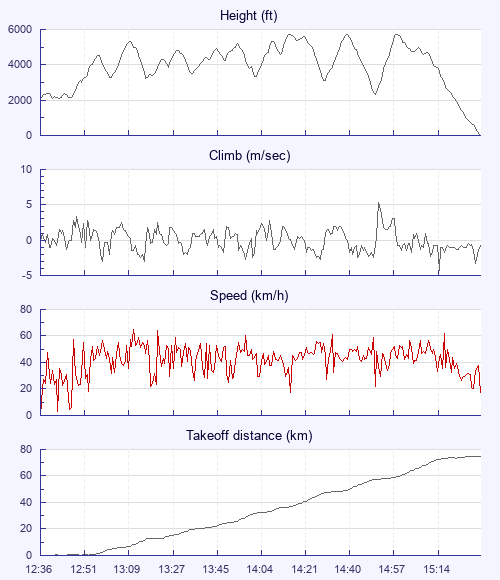
| Height - GPS data | |
| Maximum Height [15:01:20] |
5725 ft |
| Lowest Save [14:53:40] |
2339 ft |
| Takeoff Height [12:36:57] |
2119 ft |
| Landing Height [15:34:56] |
0 ft |
| Total Ascent | 20381 ft |
| Height Gain | |
| Above Takeoff | 3606 ft |
| Maximum | 3655 ft |
| Low Point [12:43:54] |
2070 ft |
| High Point as Maximum Height |
5725 ft |
| Units | |
| Climb - GPS data | |
| Maximum Climb [14:54:33] |
5.3 m/s |
| Minimum Climb [15:19:01] |
-4.3 m/s |
| Units | |
| Speed | |
| Maximum Speed [13:12:49] |
64.8 km/h |
| Average Speed around course |
27.3 km/h |
| Average Speed over track length |
42.8 km/h |
| Units | |
| Tracklog | |
| Flight Duration | 2hrs 57mins |
| Track Points | 10679 |
| Recording Interval | 1 secs |
| Statistics Interval | 4 secs |
| Track Length | 127.1 km |
| Invalid Positions [< 1%] |
1 |
| Units | |
| Flight instrument | |
| Type | Huawei Lya-l29 10 |
| Model | Not Set |
| Firmware | 0.9.6.1-beta |
| Height: | |
| Speed: | |
| Climb: | |
| Distance: |
| Main Map: |
| First Tab: |