


| Duration | 0:00 | Takeoff Distance | 0 |
| Height: | metres |
| Climb: | m/sec |
| Speed: | km/h |
| Distance: | km |
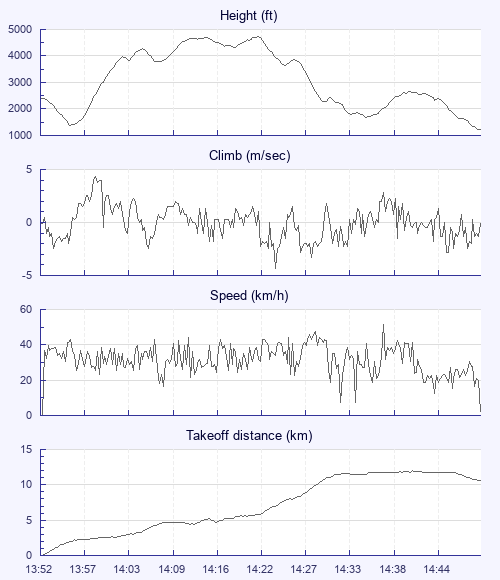
| Height - GPS data | |
| Maximum Height [14:22:02] |
4731 ft |
| Lowest Save [13:56:10] |
1394 ft |
| Takeoff Height [13:52:18] |
2398 ft |
| Landing Height [14:50:59] |
1224 ft |
| Total Ascent | 6965 ft |
| Height Gain | |
| Above Takeoff | 2333 ft |
| Maximum | 3337 ft |
| Low Point as Lowest Save |
1394 ft |
| High Point as Maximum Height |
4731 ft |
| Units | |
| Climb - Pressure data | |
| Maximum Climb [13:59:18] |
4.3 m/s |
| Minimum Climb [14:24:10] |
-4.3 m/s |
| Units | |
| Speed | |
| Maximum Speed [14:38:18] |
51.3 km/h |
| Average Speed around course |
16.2 km/h |
| Average Speed over track length |
32.1 km/h |
| Units | |
| Tracklog | |
| Flight Duration | 58mins |
| Track Points | 3522 |
| Recording Interval | 1 secs |
| Statistics Interval | 4 secs |
| Track Length | 31.4 km |
| Units | |
| Flight instrument | |
| Type | Oudie 3 |
| Model | Not Set |
| Firmware | 9.25.001 |
| Height: | |
| Speed: | |
| Climb: | |
| Distance: |
| Main Map: |
| First Tab: |