


| Duration | 0:00 | Takeoff Distance | 0 |
| Height: | metres |
| Climb: | m/sec |
| Speed: | km/h |
| Distance: | km |
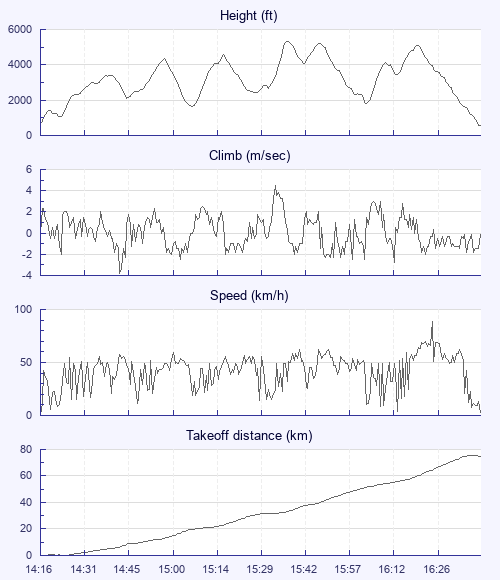
| Height - GPS data | |
| Maximum Height [15:38:19] |
5348 ft |
| Lowest Save [15:07:33] |
1667 ft |
| Takeoff Height [14:16:56] |
699 ft |
| Landing Height [16:42:17] |
571 ft |
| Total Ascent | 18888 ft |
| Height Gain | |
| Above Takeoff | 4649 ft |
| Units | |
| Climb - Pressure data | |
| Maximum Climb [15:34:44] |
4.5 m/s |
| Minimum Climb [14:43:00] |
-3.8 m/s |
| Units | |
| Speed | |
| Maximum Speed [16:27:20] |
89.1 km/h |
| Average Speed around course |
34.3 km/h |
| Average Speed over track length |
42.7 km/h |
| Units | |
| Tracklog | |
| Flight Duration | 2hrs 25mins |
| Track Points | 8722 |
| Recording Interval | 1 secs |
| Statistics Interval | 4 secs |
| Track Length | 103.4 km |
| Units | |
| Flight instrument | |
| Type | Oudie 5 Pro |
| Model | R |
| Firmware | 9.31.001 |
| Height: | |
| Speed: | |
| Climb: | |
| Distance: |
| Main Map: |
| First Tab: |