


| Duration | 0:00 | Takeoff Distance | 0 |
| Height: | metres |
| Climb: | m/sec |
| Speed: | km/h |
| Distance: | km |
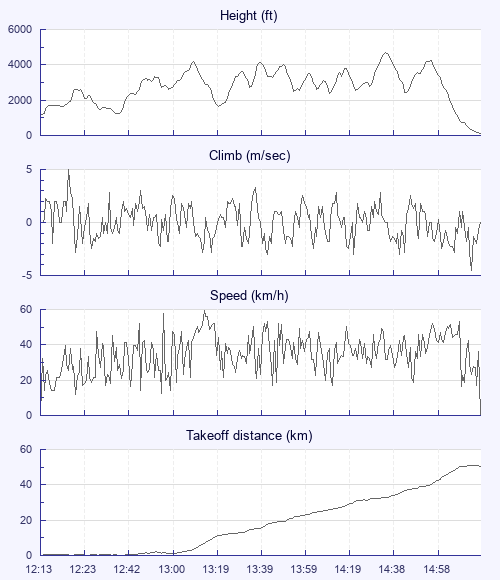
| Height - GPS data | |
| Maximum Height [14:35:45] |
4678 ft |
| Lowest Save [12:38:25] |
1224 ft |
| Takeoff Height [12:13:58] |
1181 ft |
| Landing Height [15:14:42] |
102 ft |
| Total Ascent | 21430 ft |
| Height Gain | |
| Above Takeoff | 3497 ft |
| Maximum | 3507 ft |
| Low Point [12:14:15] |
1171 ft |
| High Point as Maximum Height |
4678 ft |
| Units | |
| Climb - Pressure data | |
| Maximum Climb [12:18:07] |
5.0 m/s |
| Minimum Climb [15:13:37] |
-4.5 m/s |
| Units | |
| Speed | |
| Maximum Speed [13:14:53] |
59.4 km/h |
| Average Speed around course |
19.1 km/h |
| Average Speed over track length |
34.9 km/h |
| Units | |
| Tracklog | |
| Flight Duration | 3hrs |
| Track Points | 2840 |
| Recording Interval | 4 secs |
| Statistics Interval | 4 secs |
| Track Length | 105.2 km |
| Units | |
| Flight instrument | |
| Type | Oudie 3 |
| Model | Y |
| Firmware | 9.33.001 |
| Height: | |
| Speed: | |
| Climb: | |
| Distance: |
| Main Map: |
| First Tab: |