


| Duration | 0:00 | Takeoff Distance | 0 |
| Height: | metres |
| Climb: | m/sec |
| Speed: | km/h |
| Distance: | km |
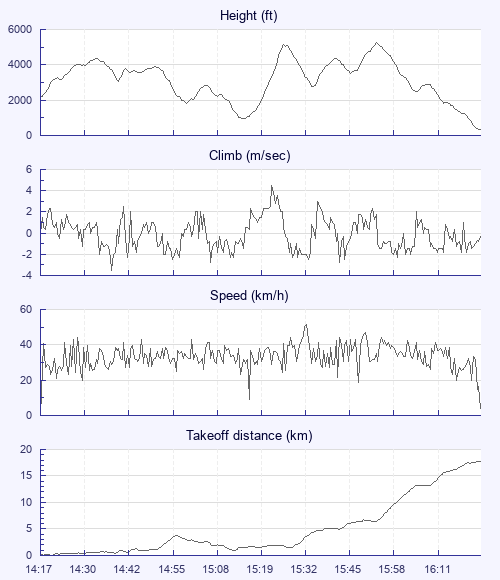
| Height - GPS data | |
| Maximum Height [15:54:55] |
5236 ft |
| Lowest Save [15:16:15] |
938 ft |
| Takeoff Height [14:17:31] |
2172 ft |
| Landing Height [16:25:40] |
315 ft |
| Total Ascent | 14672 ft |
| Height Gain | |
| Above Takeoff | 3064 ft |
| Maximum | 4298 ft |
| Low Point as Lowest Save |
938 ft |
| High Point as Maximum Height |
5236 ft |
| Units | |
| Climb - Pressure data | |
| Maximum Climb [15:23:43] |
4.5 m/s |
| Minimum Climb [14:37:51] |
-3.5 m/s |
| Units | |
| Speed | |
| Maximum Speed [15:33:55] |
51.3 km/h |
| Average Speed around course |
15.0 km/h |
| Average Speed over track length |
33.5 km/h |
| Units | |
| Tracklog | |
| Flight Duration | 2hrs 8mins |
| Track Points | 7690 |
| Recording Interval | 1 secs |
| Statistics Interval | 4 secs |
| Track Length | 71.6 km |
| Units | |
| Flight instrument | |
| Type | Oudie 4 Full |
| Model | Y |
| Firmware | 9.31.001 |
| Height: | |
| Speed: | |
| Climb: | |
| Distance: |
| Main Map: |
| First Tab: |