


| Duration | 0:00 | Takeoff Distance | 0 |
| Height: | metres |
| Climb: | m/sec |
| Speed: | km/h |
| Distance: | km |
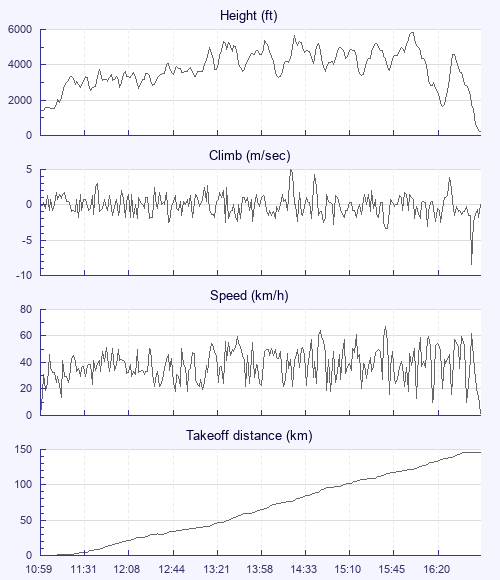
| Height - GPS data | |
| Maximum Height [16:07:40] |
5814 ft |
| Lowest Save [16:31:14] |
1650 ft |
| Takeoff Height [10:59:14] |
1467 ft |
| Landing Height [16:56:20] |
200 ft |
| Total Ascent | 42536 ft |
| Height Gain | |
| Above Takeoff | 4347 ft |
| Maximum | 4426 ft |
| Low Point [11:00:07] |
1388 ft |
| High Point as Maximum Height |
5814 ft |
| Units | |
| Climb - Pressure data | |
| Maximum Climb [14:26:28] |
5.0 m/s |
| Minimum Climb [16:51:56] |
-8.5 m/s |
| Units | |
| Speed | |
| Maximum Speed [15:45:24] |
67.5 km/h |
| Average Speed around course |
25.5 km/h |
| Average Speed over track length |
38.9 km/h |
| Units | |
| Tracklog | |
| Flight Duration | 5hrs 57mins |
| Track Points | 21425 |
| Recording Interval | 1 secs |
| Statistics Interval | 4 secs |
| Track Length | 231.5 km |
| Units | |
| Flight instrument | |
| Type | Xiaomi Mi A2 10 |
| Model | Not Set |
| Firmware | 0.9.5.3 |
| Height: | |
| Speed: | |
| Climb: | |
| Distance: |
| Main Map: |
| First Tab: |