


| Duration | 0:00 | Takeoff Distance | 0 |
| Height: | metres |
| Climb: | m/sec |
| Speed: | km/h |
| Distance: | km |
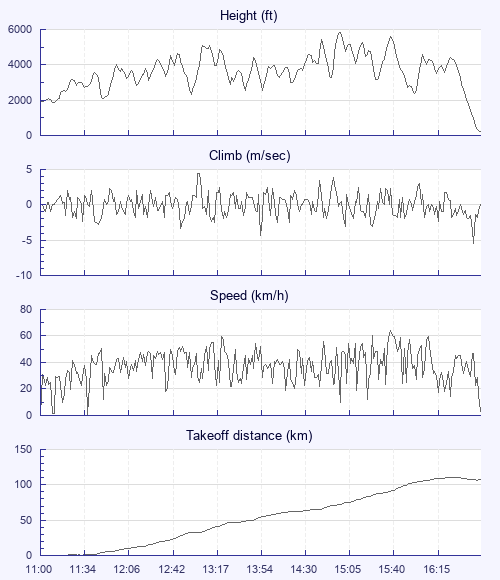
| Height - GPS data | |
| Maximum Height [14:58:53] |
5833 ft |
| Lowest Save [11:45:46] |
2090 ft |
| Takeoff Height [11:00:36] |
1844 ft |
| Landing Height [16:44:56] |
200 ft |
| Total Ascent | 41138 ft |
| Height Gain | |
| Above Takeoff | 3990 ft |
| Maximum | 4003 ft |
| Low Point [11:01:07] |
1831 ft |
| High Point as Maximum Height |
5833 ft |
| Units | |
| Climb - Pressure data | |
| Maximum Climb [13:03:16] |
4.5 m/s |
| Minimum Climb [16:42:24] |
-5.5 m/s |
| Units | |
| Speed | |
| Maximum Speed [15:39:40] |
63.9 km/h |
| Average Speed around course |
22.7 km/h |
| Average Speed over track length |
37.6 km/h |
| Units | |
| Tracklog | |
| Flight Duration | 5hrs 44mins |
| Track Points | 20661 |
| Recording Interval | 1 secs |
| Statistics Interval | 4 secs |
| Track Length | 215.9 km |
| Units | |
| Height: | |
| Speed: | |
| Climb: | |
| Distance: |
| Main Map: |
| First Tab: |