


| Duration | 0:00 | Takeoff Distance | 0 |
| Height: | metres |
| Climb: | m/sec |
| Speed: | km/h |
| Distance: | km |
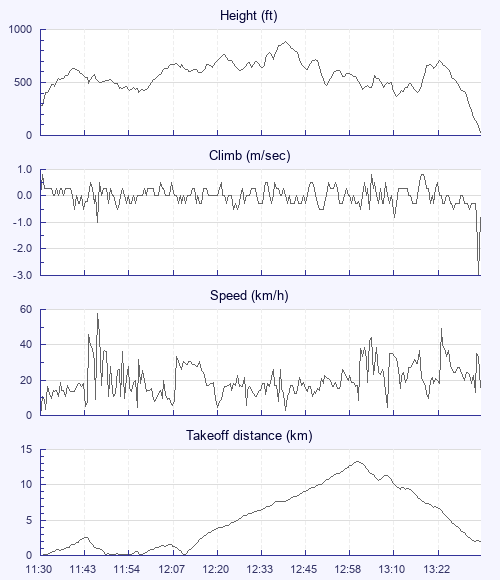
| Height - GPS data | |
| Maximum Height [12:41:59] |
889 ft |
| Takeoff Height [11:30:53] |
272 ft |
| Landing Height [13:37:39] |
30 ft |
| Total Ascent | 4173 ft |
| Height Gain | |
| Above Takeoff | 617 ft |
| Maximum | 620 ft |
| Low Point [11:30:54] |
269 ft |
| High Point as Maximum Height |
889 ft |
| Units | |
| Climb - Pressure data | |
| Maximum Climb [11:31:25] |
0.8 m/s |
| Minimum Climb [13:37:21] |
-3.0 m/s |
| Units | |
| Speed | |
| Maximum Speed [11:46:45] |
57.6 km/h |
| Average Speed around course |
14.2 km/h |
| Average Speed over track length |
20.4 km/h |
| Units | |
| Tracklog | |
| Flight Duration | 2hrs 6mins |
| Track Points | 7607 |
| Recording Interval | 1 secs |
| Statistics Interval | 4 secs |
| Track Length | 43.0 km |
| Units | |
| Flight instrument | |
| Type | Oudie 5 Pro |
| Model | R |
| Firmware | 9.33.001 |
| Height: | |
| Speed: | |
| Climb: | |
| Distance: |
| Main Map: |
| First Tab: |