


| Duration | 0:00 | Takeoff Distance | 0 |
| Height: | metres |
| Climb: | m/sec |
| Speed: | km/h |
| Distance: | km |
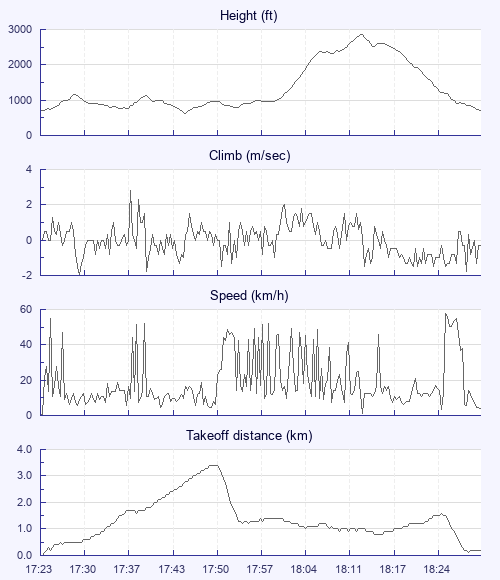
| Height - GPS data | |
| Maximum Height [18:14:21] |
2854 ft |
| Takeoff Height [17:23:59] |
699 ft |
| Landing Height [18:32:13] |
705 ft |
| Total Ascent | 5046 ft |
| Height Gain | |
| Above Takeoff | 2156 ft |
| Maximum | 2247 ft |
| Low Point [17:46:35] |
607 ft |
| High Point as Maximum Height |
2854 ft |
| Units | |
| Climb - Pressure data | |
| Maximum Climb [17:37:51] |
2.8 m/s |
| Minimum Climb [17:29:51] |
-2.0 m/s |
| Units | |
| Speed | |
| Maximum Speed [18:27:15] |
57.6 km/h |
| Average Speed around course |
9.0 km/h |
| Average Speed over track length |
18.1 km/h |
| Units | |
| Tracklog | |
| Flight Duration | 1hr 8mins |
| Track Points | 4095 |
| Recording Interval | 1 secs |
| Statistics Interval | 4 secs |
| Track Length | 20.6 km |
| Units | |
| Height: | |
| Speed: | |
| Climb: | |
| Distance: |
| Main Map: |
| First Tab: |