Xc Title
User:Guest
Naviter advert
Anthony Moore  All flights
National League 2021
Flight type image
Turnpoint Flight on a Paraglider
Club
North Devon
Glider
Flow Fusion Light
Date
17th April 2021
Start
12:25
Finish
14:39
Duration
2hrs 13mins
Takeoff
Pandy
Landing
Nr Brecon
Coords
Takeoff
51.91112, -2.99668
Start
51.91112, -2.99668
TP1
51.92112, -2.99678
TP2
51.89242, -3.44797
TP3
51.94023, -3.37795
Finish
51.93925, -3.39842
Landing
51.93925, -3.39842
Distances and Score
Leg 1
1.11k
Leg 2
31.21k
Leg 3
7.18k
Leg 4
1.41k
Total
40.91k
Score
40.9
Open Distance
Total
31.5k
Filename
Use full pilot name
Download
Validated
Yes
Flight map
Notes

This map gives an overview of the flight, using the turnpoints to plot the track.

Use the for a detailed map and flight track.

Duration 0:00   Takeoff Distance 0
Controls
To animate the flight: click a point on the track, use the slider, or click the Play button.
slider
slider
Speed
Speed
Slower
Faster
Track color
No data
Highlights
Track data
Time: No data
Height:
Climb:
Speed:
Interval:
Units
Height: metres
Climb: m/sec
Speed: km/h
Distance: km
chart
Notes

Climb and Speed averaged over 4 second intervals.

These values may be lower than those shown by a flight instrument, which has access to continuous raw data.

Red values indicate suspect data, because the tracklog contains invalid points.

Metric units are used for all chart data, except for Height which is shown in feet.

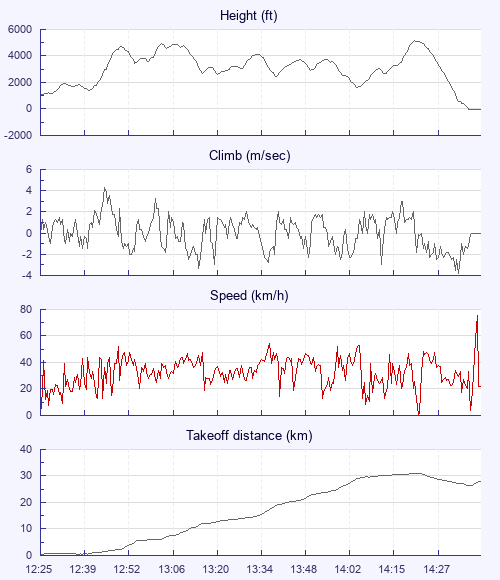
Height   -   Pressure data
Maximum Height
[14:22:26]
5167 ft
Lowest Save
[14:05:20]
1654 ft
Takeoff Height
[12:25:54]
1063 ft
Landing Height
[14:39:25]
-13 ft
Total Ascent 16470 ft
Height Gain
Above Takeoff 4104 ft
Maximum 4114 ft
Low Point
[12:26:07]
1053 ft
High Point
as Maximum Height
5167 ft
Units
Climb   -   Pressure data
Maximum Climb
[12:45:02]
4.3 m/s
Minimum Climb
[14:34:52]
-3.8 m/s
Units
Speed
Maximum Speed
[14:39:12]
75.6 km/h
Average Speed
around course
18.4 km/h
Average Speed
over track length
32.4 km/h
Units
Tracklog
Flight Duration 2hrs 13mins
Track Points 7971
Recording Interval 1 secs
Statistics Interval 4 secs
Track Length 72.2 km
Invalid Positions
[< 1%]
21
Units
Flight instrument
Type Oudie 5 Pro
Model R
Firmware 9.31.001
Notes

Climb and Speed averaged over 4 second intervals.

These values may be lower than those shown by a flight instrument, which has access to continuous raw data.

Red values indicate suspect data, because the tracklog contains invalid points.

Average Speed around course is measured from Start to Finish points.

Track Length is the cumulative distance between track points from Takeoff to Landing.

You can change the default units displayed - see the Options page.

Use this page to set various display Options. You can choose which units are used to display flight data, which map to show when the starts and which tab to show each time you view a flight.
Units settings

Metric units are used by default for the Statistics and XC Player pages, except for Height data which is shown in feet. You can choose your own custom settings here.

Height:
Speed:
Climb:
Distance:
  Use default
XC Player settings

When the XC Player starts, the track data is shown on the Hybrid map. You can choose a different map here.

Main Map:
  Use default
Tab settings

The first tab shown when you view a flight is the Flight Map. You can choose a different tab here.

First Tab:
  Use default
Notes

This page uses cookies to save your settings for future visits.

If you have disabled cookies for this site then any changes you make will not be saved.