


| Duration | 0:00 | Takeoff Distance | 0 |
| Height: | metres |
| Climb: | m/sec |
| Speed: | km/h |
| Distance: | km |
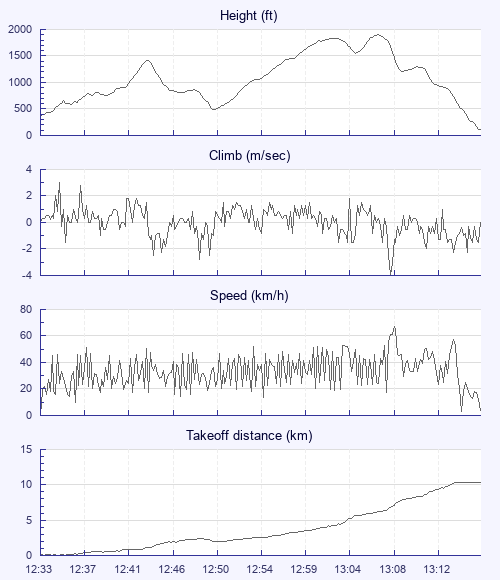
| Height - GPS data | |
| Maximum Height [13:07:02] |
1903 ft |
| Lowest Save [12:50:12] |
492 ft |
| Takeoff Height [12:33:08] |
367 ft |
| Landing Height [13:16:48] |
108 ft |
| Total Ascent | 3776 ft |
| Height Gain | |
| Above Takeoff | 1535 ft |
| Units | |
| Climb - Pressure data | |
| Maximum Climb [12:34:48] |
3.0 m/s |
| Minimum Climb [13:07:56] |
-4.0 m/s |
| Units | |
| Speed | |
| Maximum Speed [13:08:20] |
67.5 km/h |
| Average Speed around course |
17.3 km/h |
| Average Speed over track length |
34.2 km/h |
| Units | |
| Tracklog | |
| Flight Duration | 43mins |
| Track Points | 2621 |
| Recording Interval | 1 secs |
| Statistics Interval | 4 secs |
| Track Length | 24.9 km |
| Units | |
| Flight instrument | |
| Type | Xc_tracer_maxx |
| Model | Not Set |
| Firmware | Xc_tracer_maxx_r07 |
| Height: | |
| Speed: | |
| Climb: | |
| Distance: |
| Main Map: |
| First Tab: |