


| Duration | 0:00 | Takeoff Distance | 0 |
| Height: | metres |
| Climb: | m/sec |
| Speed: | km/h |
| Distance: | km |
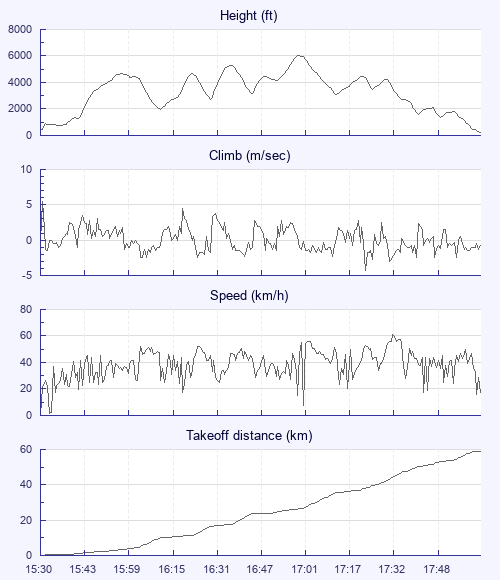
| Height - GPS data | |
| Maximum Height [17:01:07] |
6056 ft |
| Lowest Save [17:50:05] |
1385 ft |
| Takeoff Height [15:30:10] |
341 ft |
| Landing Height [18:02:41] |
213 ft |
| Total Ascent | 19754 ft |
| Height Gain | |
| Above Takeoff | 5715 ft |
| Units | |
| Climb - Pressure data | |
| Maximum Climb [15:30:18] |
5.5 m/s |
| Minimum Climb [17:23:38] |
-4.3 m/s |
| Units | |
| Speed | |
| Maximum Speed [17:33:06] |
61.2 km/h |
| Average Speed around course |
24.6 km/h |
| Average Speed over track length |
39.3 km/h |
| Units | |
| Tracklog | |
| Flight Duration | 2hrs 32mins |
| Track Points | 9152 |
| Recording Interval | 1 secs |
| Statistics Interval | 4 secs |
| Track Length | 99.9 km |
| Units | |
| Flight instrument | |
| Type | Xc_tracer_maxx |
| Model | Not Set |
| Firmware | Xc_tracer_maxx_r07_rc24 |
| Height: | |
| Speed: | |
| Climb: | |
| Distance: |
| Main Map: |
| First Tab: |