


| Duration | 0:00 | Takeoff Distance | 0 |
| Height: | metres |
| Climb: | m/sec |
| Speed: | km/h |
| Distance: | km |
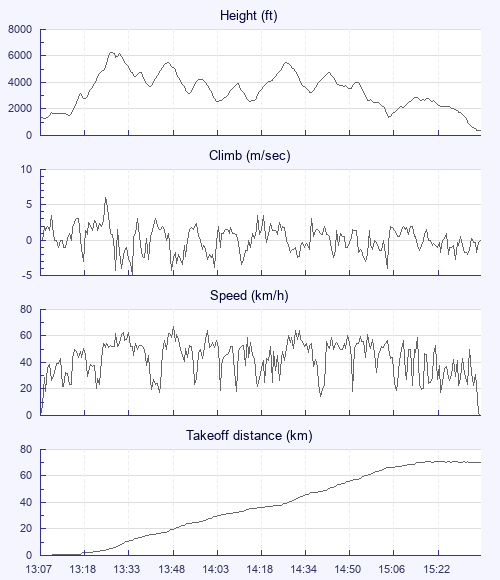
| Height - GPS data | |
| Maximum Height [13:28:11] |
6250 ft |
| Lowest Save [15:07:51] |
1365 ft |
| Takeoff Height [13:07:42] |
1345 ft |
| Landing Height [15:39:04] |
348 ft |
| Total Ascent | 19249 ft |
| Height Gain | |
| Above Takeoff | 4905 ft |
| Maximum | 4970 ft |
| Low Point [13:08:25] |
1280 ft |
| High Point as Maximum Height |
6250 ft |
| Units | |
| Climb - Pressure data | |
| Maximum Climb [13:26:23] |
6.0 m/s |
| Minimum Climb [13:34:51] |
-5.0 m/s |
| Units | |
| Speed | |
| Maximum Speed [13:49:27] |
67.5 km/h |
| Average Speed around course |
29.9 km/h |
| Average Speed over track length |
43.0 km/h |
| Units | |
| Tracklog | |
| Flight Duration | 2hrs 31mins |
| Track Points | 2338 |
| Recording Interval | 4 secs |
| Statistics Interval | 4 secs |
| Track Length | 108.5 km |
| Units | |
| Flight instrument | |
| Type | Oudie 4 Full |
| Model | Not Set |
| Firmware | 9.23.001 |
| Height: | |
| Speed: | |
| Climb: | |
| Distance: |
| Main Map: |
| First Tab: |