


| Duration | 0:00 | Takeoff Distance | 0 |
| Height: | metres |
| Climb: | m/sec |
| Speed: | km/h |
| Distance: | km |
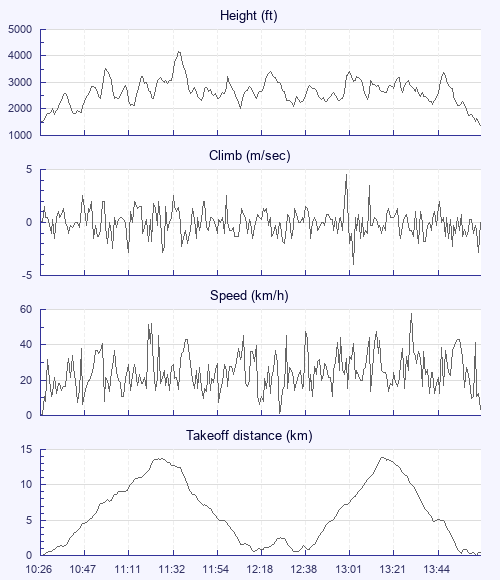
| Height - GPS data | |
| Maximum Height [11:35:06] |
4177 ft |
| Lowest Save [10:43:00] |
1837 ft |
| Takeoff Height [10:26:19] |
1522 ft |
| Landing Height [14:05:31] |
1391 ft |
| Total Ascent | 23169 ft |
| Height Gain | |
| Above Takeoff | 2654 ft |
| Units | |
| Climb - Pressure data | |
| Maximum Climb [13:00:15] |
4.5 m/s |
| Minimum Climb [13:02:35] |
-4.0 m/s |
| Units | |
| Speed | |
| Maximum Speed [13:30:31] |
57.6 km/h |
| Average Speed around course |
17.1 km/h |
| Average Speed over track length |
25.6 km/h |
| Units | |
| Tracklog | |
| Flight Duration | 3hrs 39mins |
| Track Points | 13153 |
| Recording Interval | 1 secs |
| Statistics Interval | 4 secs |
| Track Length | 93.5 km |
| Units | |
| Flight instrument | |
| Type | Flymaster |
| Model | Gps+sd |
| Firmware | 2.03j |
| Height: | |
| Speed: | |
| Climb: | |
| Distance: |
| Main Map: |
| First Tab: |