


| Duration | 0:00 | Takeoff Distance | 0 |
| Height: | metres |
| Climb: | m/sec |
| Speed: | km/h |
| Distance: | km |
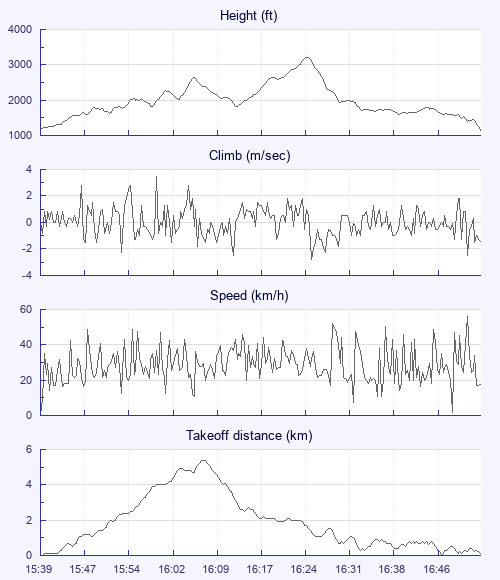
| Height - GPS data | |
| Maximum Height [16:25:51] |
3205 ft |
| Takeoff Height [15:39:47] |
1181 ft |
| Landing Height [16:54:45] |
1155 ft |
| Total Ascent | 6778 ft |
| Height Gain | |
| Above Takeoff | 2024 ft |
| Units | |
| Climb - Pressure data | |
| Maximum Climb [16:00:07] |
3.5 m/s |
| Minimum Climb [16:26:35] |
-2.8 m/s |
| Units | |
| Speed | |
| Maximum Speed [16:52:47] |
55.8 km/h |
| Average Speed around course |
12.1 km/h |
| Average Speed over track length |
29.0 km/h |
| Units | |
| Tracklog | |
| Flight Duration | 1hr 14mins |
| Track Points | 4499 |
| Recording Interval | 1 secs |
| Statistics Interval | 4 secs |
| Track Length | 36.2 km |
| Units | |
| Flight instrument | |
| Type | Flyskyhy |
| Model | 7.3.1 |
| Firmware | 7.3.1 |
| Height: | |
| Speed: | |
| Climb: | |
| Distance: |
| Main Map: |
| First Tab: |