


| Duration | 0:00 | Takeoff Distance | 0 |
| Height: | metres |
| Climb: | m/sec |
| Speed: | km/h |
| Distance: | km |
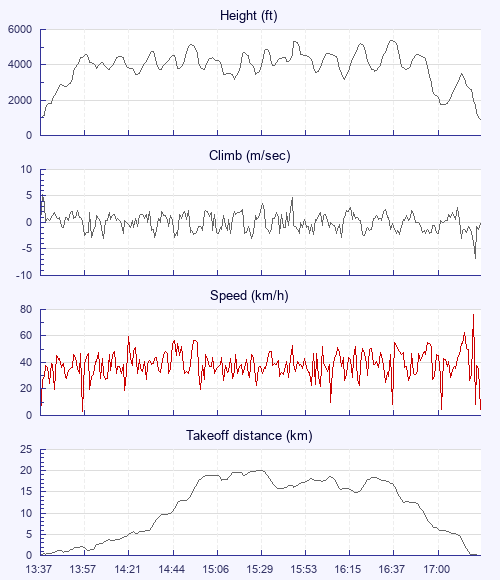
| Height - GPS data | |
| Maximum Height [16:37:16] |
5400 ft |
| Lowest Save [17:02:33] |
1775 ft |
| Takeoff Height [13:37:27] |
951 ft |
| Landing Height [17:18:44] |
886 ft |
| Total Ascent | 21736 ft |
| Height Gain | |
| Above Takeoff | 4449 ft |
| Units | |
| Climb - Pressure data | |
| Maximum Climb [13:38:07] |
5.3 m/s |
| Minimum Climb [17:17:08] |
-6.8 m/s |
| Units | |
| Speed | |
| Maximum Speed [17:17:00] |
76.5 km/h |
| Average Speed around course |
14.1 km/h |
| Average Speed over track length |
38.0 km/h |
| Units | |
| Tracklog | |
| Flight Duration | 3hrs 41mins |
| Track Points | 13234 |
| Recording Interval | 1 secs |
| Statistics Interval | 4 secs |
| Track Length | 140.0 km |
| Invalid Positions [< 1%] |
3 |
| Units | |
| Flight instrument | |
| Type | Flyskyhy |
| Model | 7.2 |
| Firmware | 7.2 |
| Height: | |
| Speed: | |
| Climb: | |
| Distance: |
| Main Map: |
| First Tab: |