


| Duration | 0:00 | Takeoff Distance | 0 |
| Height: | metres |
| Climb: | m/sec |
| Speed: | km/h |
| Distance: | km |
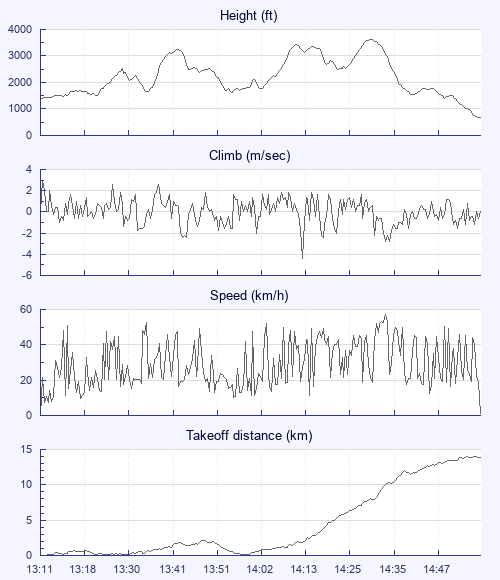
| Height - GPS data | |
| Maximum Height [14:31:41] |
3638 ft |
| Lowest Save [13:56:09] |
1631 ft |
| Takeoff Height [13:11:00] |
1388 ft |
| Landing Height [14:58:42] |
666 ft |
| Total Ascent | 9219 ft |
| Height Gain | |
| Above Takeoff | 2251 ft |
| Units | |
| Climb - Pressure data | |
| Maximum Climb [13:11:05] |
3.0 m/s |
| Minimum Climb [14:13:35] |
-4.4 m/s |
| Units | |
| Speed | |
| Maximum Speed [14:34:51] |
56.9 km/h |
| Average Speed around course |
11.6 km/h |
| Average Speed over track length |
29.5 km/h |
| Units | |
| Tracklog | |
| Flight Duration | 1hr 47mins |
| Track Points | 1317 |
| Recording Interval | 5 secs |
| Statistics Interval | 5 secs |
| Track Length | 53.0 km |
| Units | |
| Flight instrument | |
| Type | Flyskyhy |
| Model | 7.3.2 |
| Firmware | 7.3.2 |
| Height: | |
| Speed: | |
| Climb: | |
| Distance: |
| Main Map: |
| First Tab: |