Xc Title
User:Guest
Ozone advert
Alistair Guthrie  All flights
National League 2022
Flight type image
Turnpoint Flight on a Paraglider
Club
Northumbria
Glider
Date
28th May 2022
Start
11:33
Finish
16:22
Duration
4hrs 49mins
Takeoff
Tinto
Landing
Nr Longtown
Coords
Takeoff
55.59150, -3.71123
Start
55.59303, -3.69080
TP1
55.58830, -3.72185
TP2
55.60018, -3.69373
TP3
55.24147, -3.45897
Finish
55.03288, -3.01163
Landing
55.03272, -3.01268
Distances and Score
Leg 1
2.03k
Leg 2
2.21k
Leg 3
42.61k
Leg 4
36.78k
Total
83.63k
Score
83.6
Open Distance
Total
76.8k
Filename
Use full pilot name
Download
Validated
Yes
Flight map
Notes

This map gives an overview of the flight, using the turnpoints to plot the track.

Use the for a detailed map and flight track.

Duration 0:00   Takeoff Distance 0
Controls
To animate the flight: click a point on the track, use the slider, or click the Play button.
slider
slider
Speed
Speed
Slower
Faster
Track color
No data
Highlights
Track data
Time: No data
Height:
Climb:
Speed:
Interval:
Units
Height: metres
Climb: m/sec
Speed: km/h
Distance: km
chart
Notes

Climb and Speed averaged over 4 second intervals.

These values may be lower than those shown by a flight instrument, which has access to continuous raw data.

Red values indicate suspect data, because the tracklog contains invalid points.

Metric units are used for all chart data, except for Height which is shown in feet.

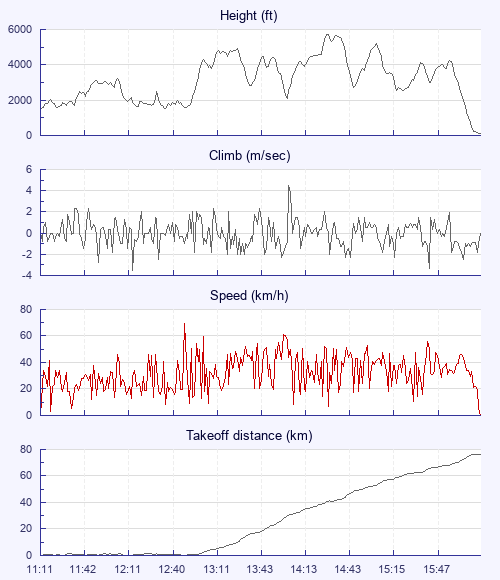
Height   -   Pressure data
Maximum Height
[14:35:34]
5725 ft
Lowest Save
[12:38:04]
1552 ft
Takeoff Height
[11:11:53]
1486 ft
Landing Height
[16:23:15]
131 ft
Total Ascent 28507 ft
Height Gain
Above Takeoff 4239 ft
Units
Climb   -   Pressure data
Maximum Climb
[14:08:33]
4.5 m/s
Minimum Climb
[12:17:05]
-3.5 m/s
Units
Speed
Maximum Speed
[12:51:46]
69.3 km/h
Average Speed
around course
17.4 km/h
Average Speed
over track length
33.5 km/h
Units
Tracklog
Flight Duration 5hrs 11mins
Track Points 18496
Recording Interval 1 secs
Statistics Interval 4 secs
Track Length 173.6 km
Invalid Positions
[< 1%]
25
Units
Flight instrument
Type Flyskyhy
Model 7.3.2
Firmware 7.3.2
Notes

Climb and Speed averaged over 4 second intervals.

These values may be lower than those shown by a flight instrument, which has access to continuous raw data.

Red values indicate suspect data, because the tracklog contains invalid points.

Average Speed around course is measured from Start to Finish points.

Track Length is the cumulative distance between track points from Takeoff to Landing.

You can change the default units displayed - see the Options page.

Use this page to set various display Options. You can choose which units are used to display flight data, which map to show when the starts and which tab to show each time you view a flight.
Units settings

Metric units are used by default for the Statistics and XC Player pages, except for Height data which is shown in feet. You can choose your own custom settings here.

Height:
Speed:
Climb:
Distance:
  Use default
XC Player settings

When the XC Player starts, the track data is shown on the Hybrid map. You can choose a different map here.

Main Map:
  Use default
Tab settings

The first tab shown when you view a flight is the Flight Map. You can choose a different tab here.

First Tab:
  Use default
Notes

This page uses cookies to save your settings for future visits.

If you have disabled cookies for this site then any changes you make will not be saved.