Xc Title
User:Guest
Ozone advert
Carl Foster  All flights
National League 2022
Flight type image
Tow-launch Turnpoint Flight on a Paraglider
Club
Norfolk
Glider
Ozone Delta 4
Date
22nd June 2022
Start
11:46
Finish
14:04
Duration
2hrs 18mins
Takeoff
Hill Farm
Landing
Nr Stanfield
Coords
Takeoff
52.69180, 0.80792
Start
52.69142, 0.81568
TP1
52.66773, 0.76423
TP2
52.66845, 0.90835
TP3
52.77302, 0.88842
Finish
52.75095, 0.85745
Landing
52.75095, 0.85750
Distances and Score
Leg 1
4.37k
Leg 2
9.75k
Leg 3
11.71k
Leg 4
3.23k
Total
29.06k
Score
29.1
Open Distance
Total
15.0k
Filename
Use full pilot name
Download
Validated
Yes
Flight map
Notes

This map gives an overview of the flight, using the turnpoints to plot the track.

Use the for a detailed map and flight track.

Duration 0:00   Takeoff Distance 0
Controls
To animate the flight: click a point on the track, use the slider, or click the Play button.
slider
slider
Speed
Speed
Slower
Faster
Track color
No data
Highlights
Track data
Time: No data
Height:
Climb:
Speed:
Interval:
Units
Height: metres
Climb: m/sec
Speed: km/h
Distance: km
chart
Notes

Climb and Speed averaged over 4 second intervals.

These values may be lower than those shown by a flight instrument, which has access to continuous raw data.

Metric units are used for all chart data, except for Height which is shown in feet.

Height   -   GPS data
Maximum Height
[13:45:47]
5351 ft
Lowest Save
[12:00:31]
928 ft
Takeoff Height
[11:44:29]
246 ft
Landing Height
[14:05:17]
217 ft
Total Ascent 19419 ft
Height Gain
Above Takeoff 5105 ft
Maximum 5112 ft
Low Point
[11:44:36]
240 ft
High Point
as Maximum Height
5351 ft
Units
Climb   -   Pressure data
Maximum Climb
[11:45:29]
6.0 m/s
Minimum Climb
[12:07:49]
-5.0 m/s
Units
Speed
Maximum Speed
[13:41:01]
54.9 km/h
Average Speed
around course
12.6 km/h
Average Speed
over track length
32.6 km/h
Units
Tracklog
Flight Duration 2hrs 20mins
Track Points 8449
Recording Interval 1 secs
Statistics Interval 4 secs
Track Length 76.5 km
Units
Flight instrument
Type Naviter
Model Oudie N
Firmware 2.4.4
Notes

Climb and Speed averaged over 4 second intervals.

These values may be lower than those shown by a flight instrument, which has access to continuous raw data.

Average Speed around course is measured from Start to Finish points.

Track Length is the cumulative distance between track points from Takeoff to Landing.

You can change the default units displayed - see the Options page.

That felt a lot of hard work for 29points. Great to have had 2:15 in the air and be able to see where you took off from and your house most of the time made the flight that little bit more special.

Forecasted light winds and lots of Notams of Fast Jets, it made planning a suitable triangle difficult decision. 40KM Triangle was decided upon. Got me excited enough to get a day off work mid week.

The Scariest part of the day is drawing straws (or in our case cards) low winches first; higher last, I had drawn an 8 which was the highest out of 3 today. So I need to get set up and ready to fly as early as possible.

Managed to get myself on the 2nd line, and found some lift right off release, Always nice when that happens.

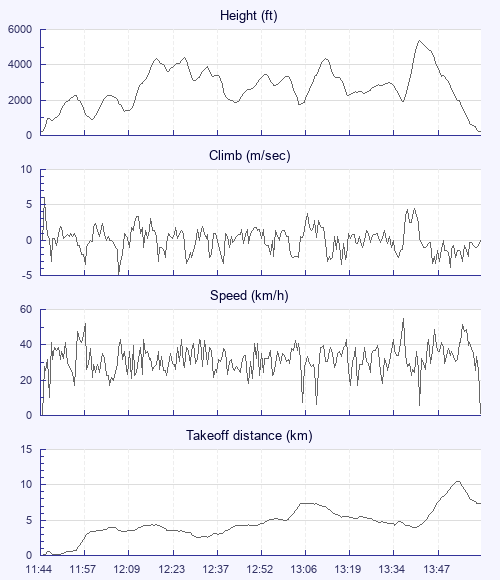
The rest of the flight I found quite challenging, the climbs or most seemed very bitty, being patient and following the '0' and.5's up, finally got me away, Watching Becky, who took the first line, get hoofed up not too far away from me, I wanted to fly to her, but, I was in something and she was far enough away for me not to lose what I got at only 1100ft. I stuck with what I had but couldn't seem to get above 2350ft. At which point I seemed to lose the climb. Do I glide down wind or back to the field?

I chose down wind, got a climb off the High power Electric Pylons which finally got me up to a decent height, most of the fight was between 1900 and 4,000 ft, Ticking off the turn points 1 by 1 slowly but surely on my last turn point I had a big push in to wind, running out of idea as loads of sink between climbs. I saw a lone seagull shoot up, so diverted to him and was rewarded with probably my strongest sustained climb ever in the UK, all the way to base, which was a bit scary with all the fast jet activity going on. With only 5km in to wind to go and a downwind dash back to the field, I thought the triangle was in the bag. ERROR, from 5200ft to Ground, ( Hero to Zero in a flash) not sure what went wrong, I presume the sea air had something to do with it, although didn't feel like I had the Seabreeze on landing.

All in all a better day than in the hot hot hot office.

Use this page to set various display Options. You can choose which units are used to display flight data, which map to show when the starts and which tab to show each time you view a flight.
Units settings

Metric units are used by default for the Statistics and XC Player pages, except for Height data which is shown in feet. You can choose your own custom settings here.

Height:
Speed:
Climb:
Distance:
  Use default
XC Player settings

When the XC Player starts, the track data is shown on the Hybrid map. You can choose a different map here.

Main Map:
  Use default
Tab settings

The first tab shown when you view a flight is the Flight Map. You can choose a different tab here.

First Tab:
  Use default
Notes

This page uses cookies to save your settings for future visits.

If you have disabled cookies for this site then any changes you make will not be saved.