


| Duration | 0:00 | Takeoff Distance | 0 |
| Height: | metres |
| Climb: | m/sec |
| Speed: | km/h |
| Distance: | km |
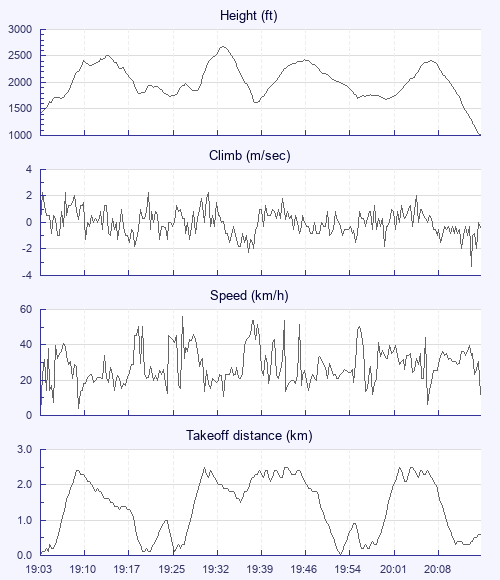
| Height - GPS data | |
| Maximum Height [19:33:57] |
2671 ft |
| Lowest Save [19:39:05] |
1621 ft |
| Takeoff Height [19:03:08] |
1414 ft |
| Landing Height [20:16:42] |
1017 ft |
| Total Ascent | 5869 ft |
| Height Gain | |
| Above Takeoff | 1257 ft |
| Maximum | 1263 ft |
| Low Point [19:03:12] |
1407 ft |
| High Point as Maximum Height |
2671 ft |
| Units | |
| Climb - Pressure data | |
| Maximum Climb [19:03:20] |
2.3 m/s |
| Minimum Climb [20:15:12] |
-3.3 m/s |
| Units | |
| Speed | |
| Maximum Speed [19:27:00] |
55.8 km/h |
| Average Speed around course |
14.7 km/h |
| Average Speed over track length |
28.6 km/h |
| Units | |
| Tracklog | |
| Flight Duration | 1hr 13mins |
| Track Points | 4415 |
| Recording Interval | 1 secs |
| Statistics Interval | 4 secs |
| Track Length | 35.1 km |
| Units | |
| Flight instrument - reported as | |
| SKYTRAXX |
| Height: | |
| Speed: | |
| Climb: | |
| Distance: |
| Main Map: |
| First Tab: |