Xc Title
User:Guest
Cloudbase Paragliding advert
Richard Bungay  All flights
Cumbria League 2022
Flight type image
Declared FAI Triangle on a Paraglider
Club
Cumbria
Glider
Gin Camino
Date
26th March 2022
Start
12:58
Finish
15:18
Duration
2hrs 19mins
Takeoff
Dale Head
Coords
Takeoff
54.52670, -3.20358
Start
54.52628, -3.20297
TP1
54.52878, -3.01700
TP2
54.61273, -3.12123
Finish
54.52628, -3.20297
Landing
54.51215, -3.19605
Distances and Score
Leg 1
12.04k
Leg 2
11.52k
Leg 3
10.98k
Distance
34.54k
Deductions
2.40k  (cylinders)
Total
32.14k
Multiplier
x 3.00
Score
96.4
Open Distance
Total
14.7k
Filename
Use full pilot name
Download
Validated
Yes
Flight map
Notes

This map gives an overview of the flight, using the turnpoints to plot the track.

Use the for a detailed map and flight track.

Duration 0:00   Takeoff Distance 0
Controls
To animate the flight: click a point on the track, use the slider, or click the Play button.
slider
slider
Speed
Speed
Slower
Faster
Track color
No data
Highlights
Track data
Time: No data
Height:
Climb:
Speed:
Interval:
Units
Height: metres
Climb: m/sec
Speed: km/h
Distance: km
chart
Notes

Climb and Speed averaged over 4 second intervals.

These values may be lower than those shown by a flight instrument, which has access to continuous raw data.

Metric units are used for all chart data, except for Height which is shown in feet.

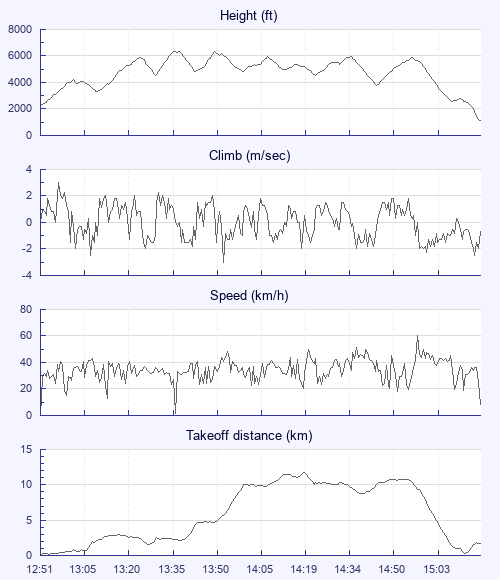
Height   -   Pressure data
Maximum Height
[13:37:32]
6365 ft
Lowest Save
[13:10:57]
3301 ft
Takeoff Height
[12:51:55]
2379 ft
Landing Height
[15:23:37]
1158 ft
Total Ascent 14675 ft
Height Gain
Above Takeoff 3986 ft
Maximum 4101 ft
Low Point
[12:52:23]
2264 ft
High Point
as Maximum Height
6365 ft
Units
Climb   -   Pressure data
Maximum Climb
[12:57:59]
3.0 m/s
Minimum Climb
[13:54:42]
-3.0 m/s
Units
Speed
Maximum Speed
[15:02:09]
60.3 km/h
Average Speed
around course
13.8 km/h
Average Speed
over track length
34.6 km/h
Units
Tracklog
Flight Duration 2hrs 31mins
Track Points 9020
Recording Interval 1 secs
Statistics Interval 4 secs
Track Length 87.5 km
Units
Flight instrument
Type Flyskyhy
Model 7.2
Firmware 7.2
Notes

Climb and Speed averaged over 4 second intervals.

These values may be lower than those shown by a flight instrument, which has access to continuous raw data.

Average Speed around course is measured from Start to Finish points.

Track Length is the cumulative distance between track points from Takeoff to Landing.

You can change the default units displayed - see the Options page.

Use this page to set various display Options. You can choose which units are used to display flight data, which map to show when the starts and which tab to show each time you view a flight.
Units settings

Metric units are used by default for the Statistics and XC Player pages, except for Height data which is shown in feet. You can choose your own custom settings here.

Height:
Speed:
Climb:
Distance:
  Use default
XC Player settings

When the XC Player starts, the track data is shown on the Hybrid map. You can choose a different map here.

Main Map:
  Use default
Tab settings

The first tab shown when you view a flight is the Flight Map. You can choose a different tab here.

First Tab:
  Use default
Notes

This page uses cookies to save your settings for future visits.

If you have disabled cookies for this site then any changes you make will not be saved.