


| Duration | 0:00 | Takeoff Distance | 0 |
| Height: | metres |
| Climb: | m/sec |
| Speed: | km/h |
| Distance: | km |
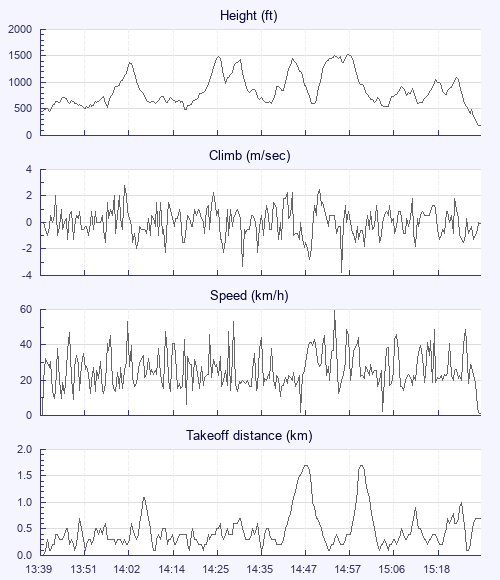
| Height - GPS data | |
| Maximum Height [14:58:56] |
1519 ft |
| Lowest Save [14:18:39] |
486 ft |
| Takeoff Height [13:39:24] |
456 ft |
| Landing Height [15:33:18] |
187 ft |
| Total Ascent | 9160 ft |
| Height Gain | |
| Above Takeoff | 1063 ft |
| Maximum | 1070 ft |
| Low Point [13:41:33] |
449 ft |
| High Point as Maximum Height |
1519 ft |
| Units | |
| Climb - GPS data | |
| Maximum Climb [14:02:16] |
2.8 m/s |
| Minimum Climb [14:57:40] |
-3.8 m/s |
| Units | |
| Speed | |
| Maximum Speed [14:56:16] |
59.4 km/h |
| Average Speed around course |
9.8 km/h |
| Average Speed over track length |
26.3 km/h |
| Units | |
| Tracklog | |
| Flight Duration | 1hr 53mins |
| Track Points | 6811 |
| Recording Interval | 1 secs |
| Statistics Interval | 4 secs |
| Track Length | 50.0 km |
| Units | |
| Flight instrument | |
| Type | Xiaomi M2006c3lg 10 |
| Model | Not Set |
| Firmware | 0.9.11.11 |
| Height: | |
| Speed: | |
| Climb: | |
| Distance: |
| Main Map: |
| First Tab: |